Result highlights
In this chapter, we briefly present the different result files and the most important and relevant parts. These result examples were generated by a test using the our example configuration file.
HTML report
Summary and configuration
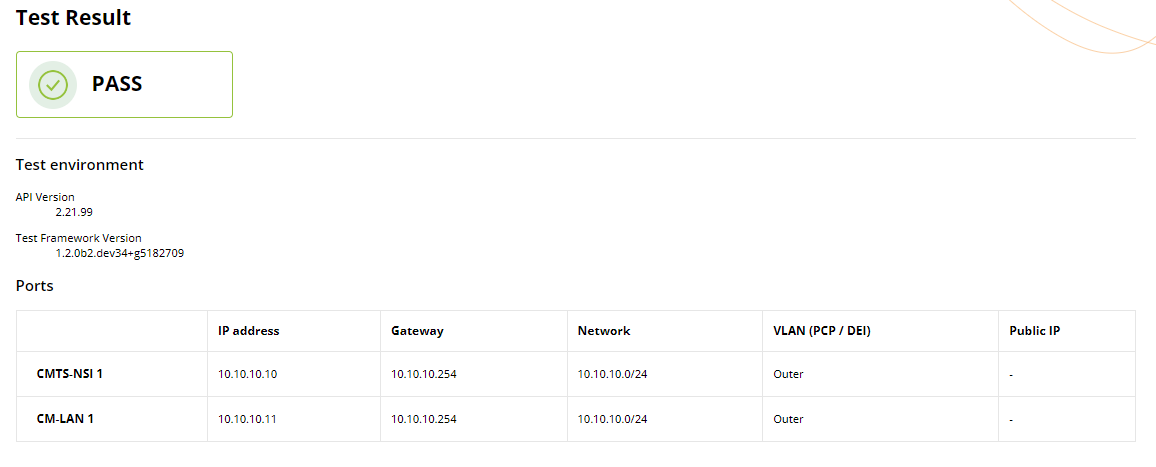
The first section of the HTML report presents a comprehensive summary of the test setup and its corresponding results. This overview starts with the test status, followed by summarizing the test environment and configuration parameters. A test is considered to have failed when the test status of at least one flow is failed (more details are provided in the next subsections).
Correlated test results
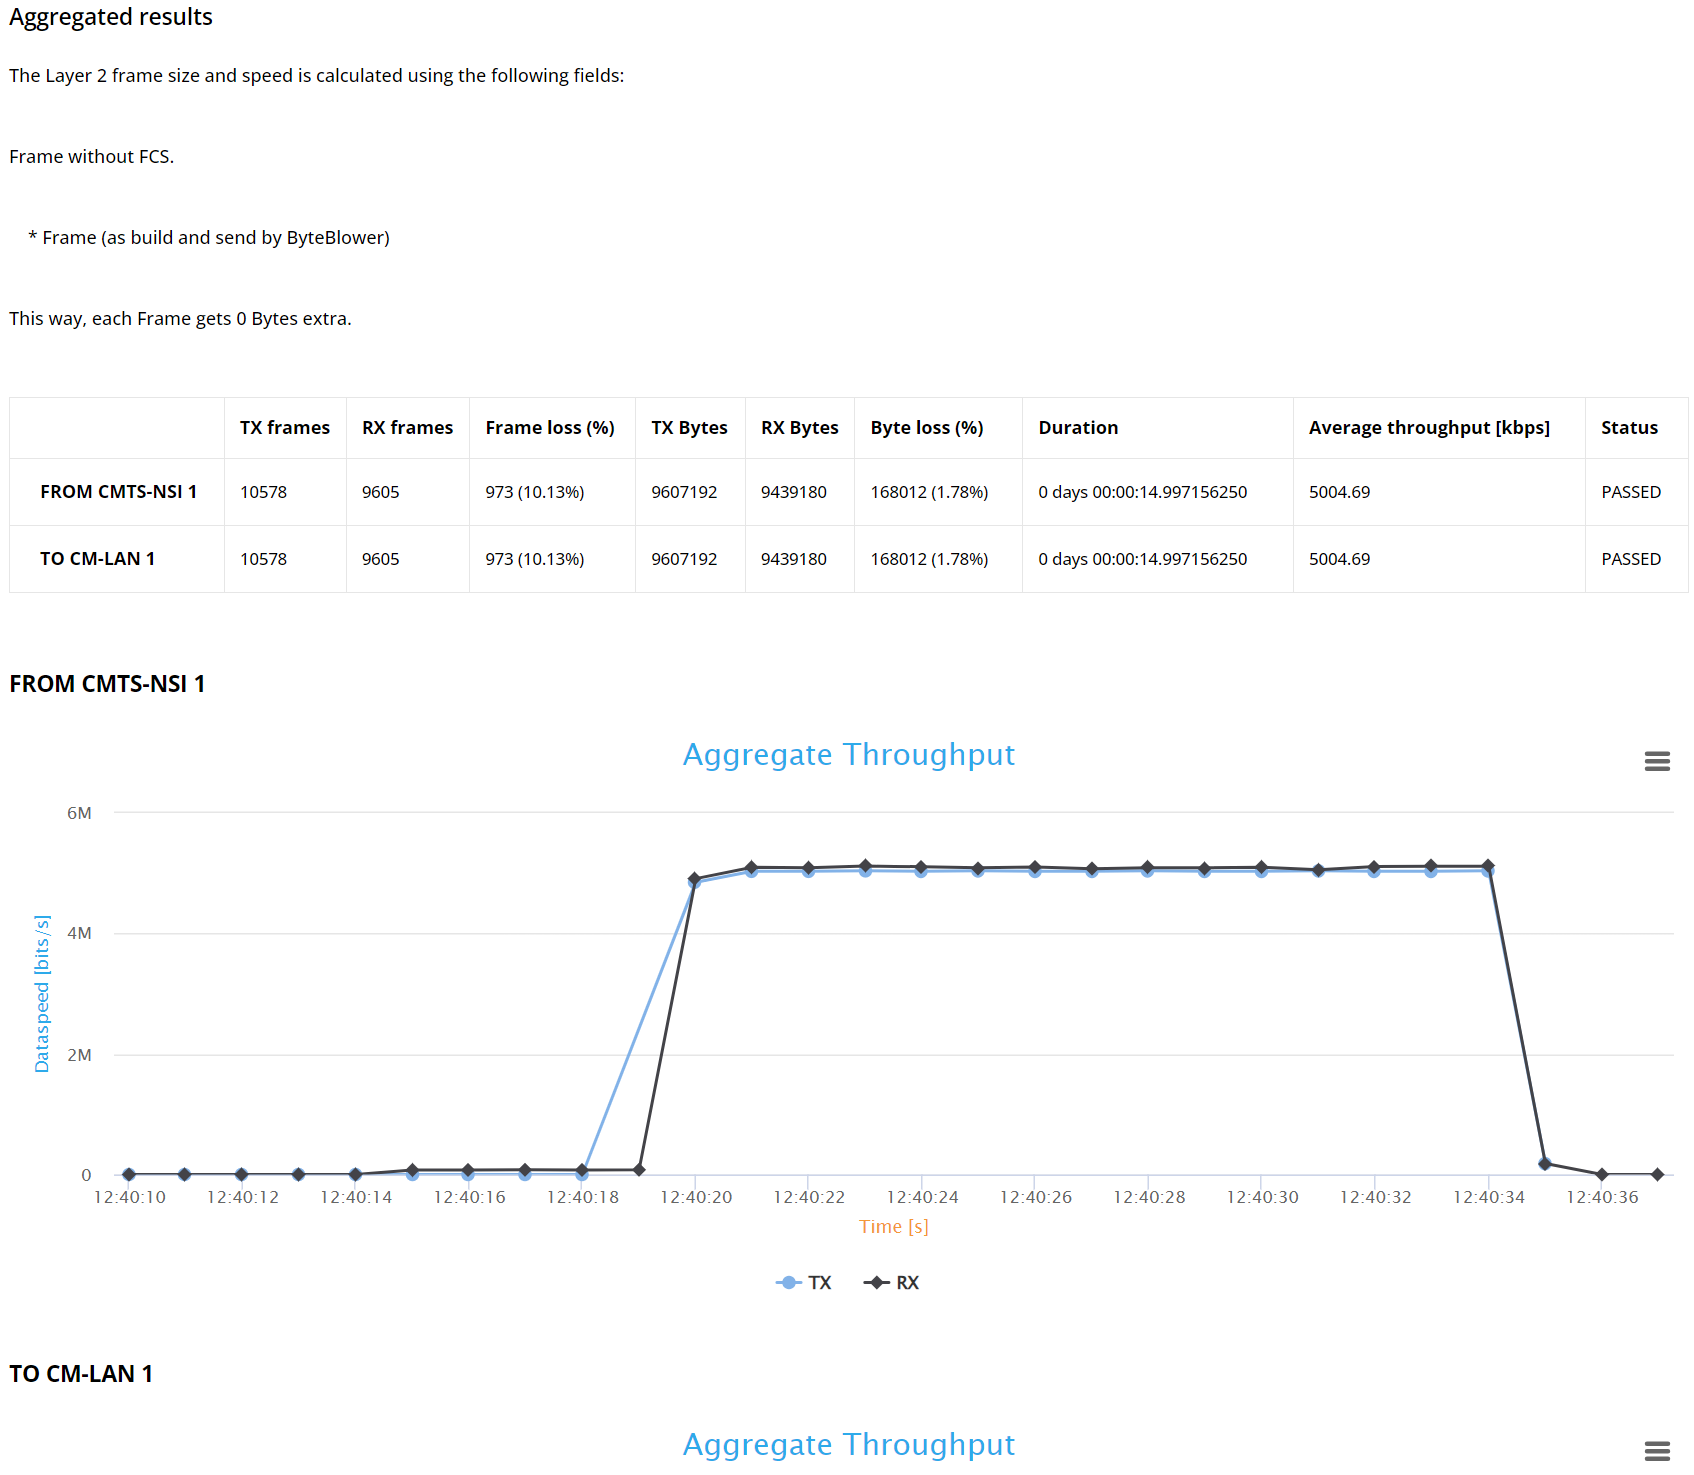
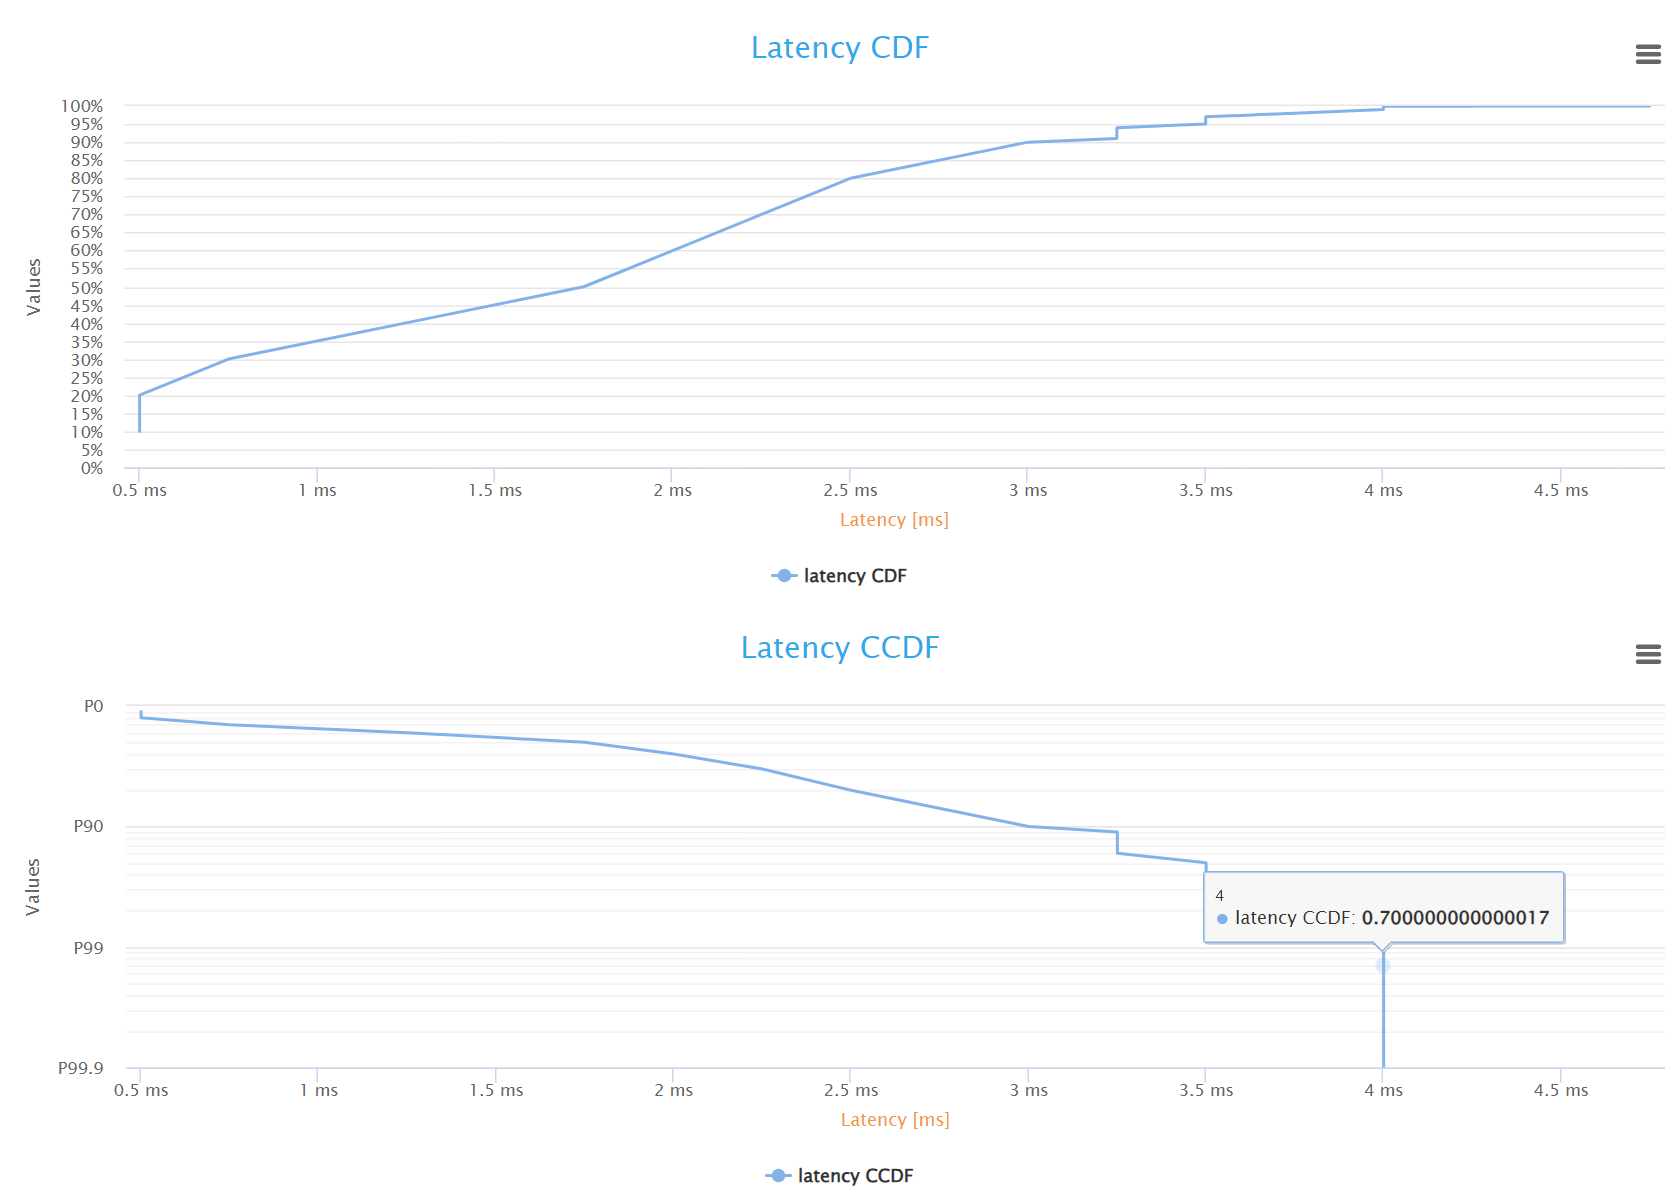
The correlated results aggregate overall test results for all flows in the test. When latency analysis is enabled for at least one flow, this section starts with the latency Complementary Cumulative Distribution Function (CCDF) graph, which illustrates the fraction of packets (percentiles) that were received above a certain latency.
Next is a table of test statistics for each port, including total number of frames and bytes transmitted/received, frame loss, run time, average throughput, and status. Finally, there is the average throughput variation graphs for every transmitting or receiving port.
Note
We currently provide aggregated throughput results for only frame blasting based flow (except the Voice flow). TCP based flow (HTTP & video flow) results are not included yet in this release.
Individual test results
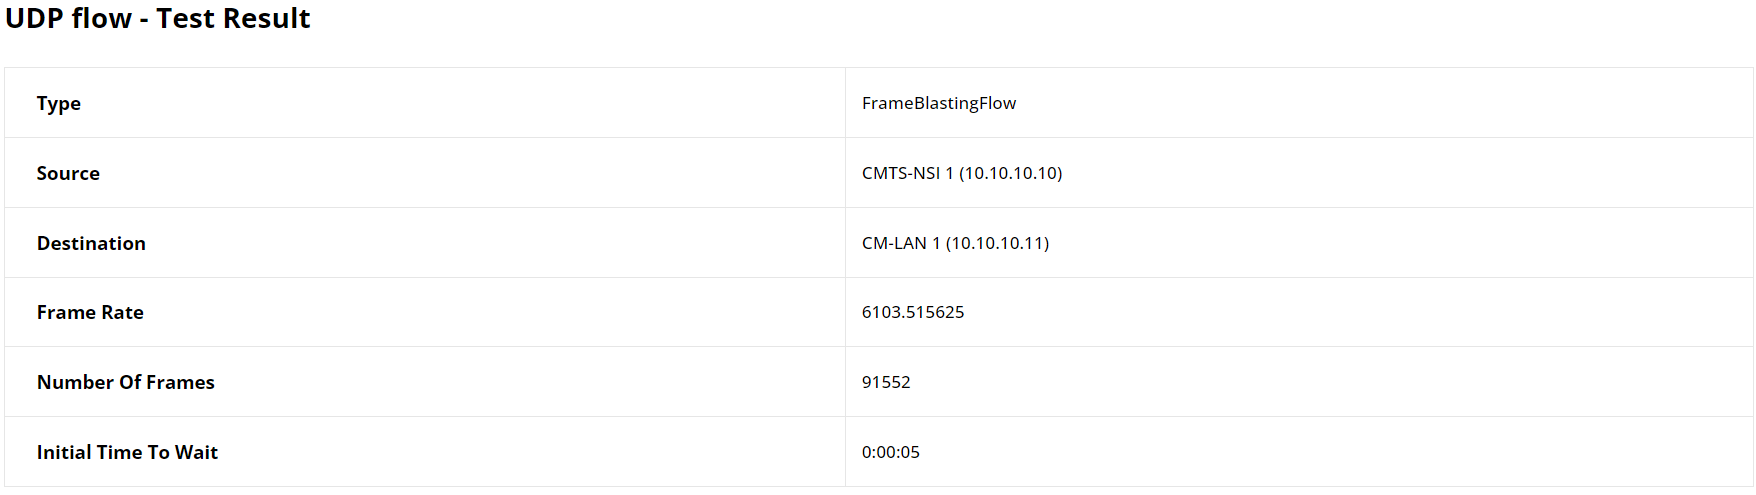
The second section details individual results for each flow, beginning with a table that outlines key configuration parameters such as flow type, source, destination, and number of frames, along with additional variables specific to the flow type.
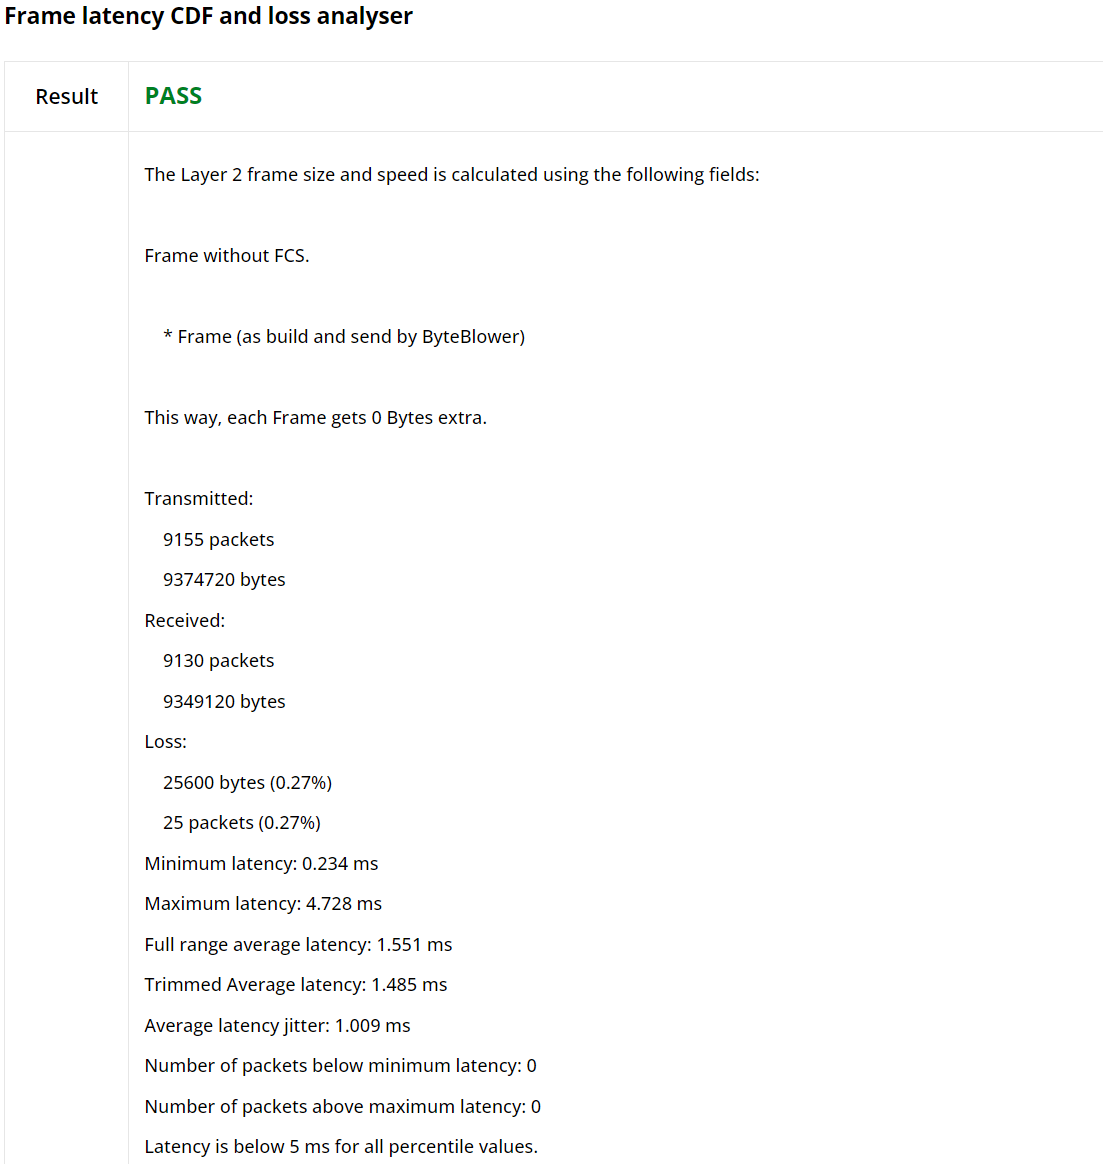
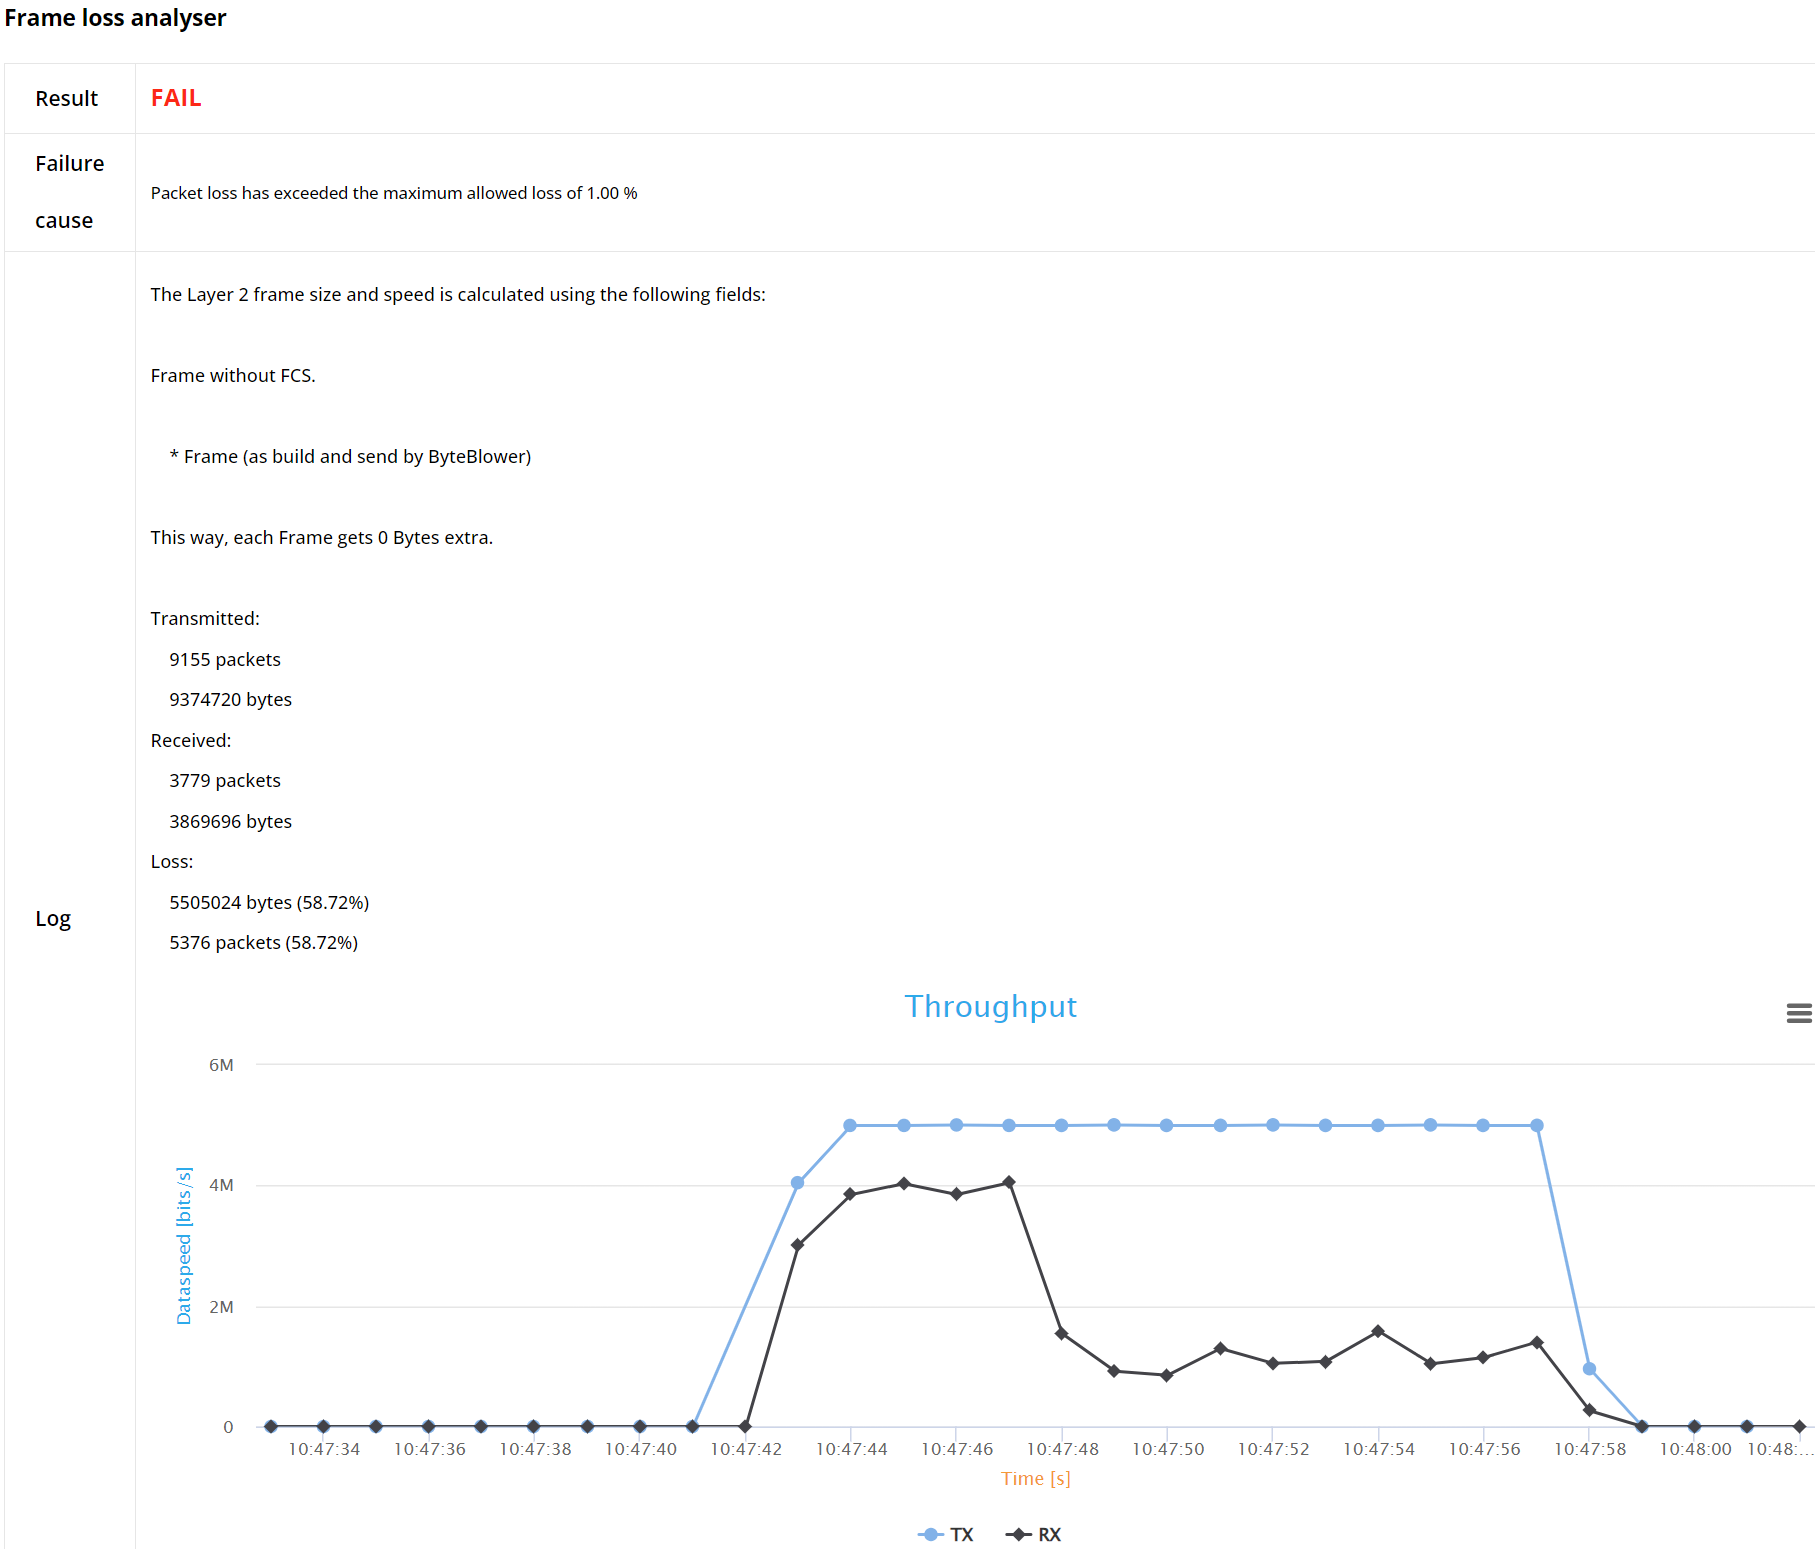
The result highlights in this section include analysis status and, in instances of failure, specifies the underlying causes.
Then, it incorporates a succinct statistical summary, revealing important metrics.
The report in general present flow results specifically related to each flow type such as transmitted and received bytes and byte loss for frame blasting based flows. Result graphs are provided to give a visual interpretation of performance, aligning closely with the distinct metrics and characteristics of each type of flow.
For frame blasting based flows where latency analysis is enabled, the summary also includes minimum, maximum, and average latency.
For Frame blasting based flows for example, the report provide transmission/reception and byte loss statistics summary. The graph shows the average throughput over time.
Note
Whether the throughput is calculated for frames without the Frame Check Sum (FCS) field, including FCS or including FCS and physical overhead can be configured in the JSON config file.
When enabled, also latency statistics over time will be shown.
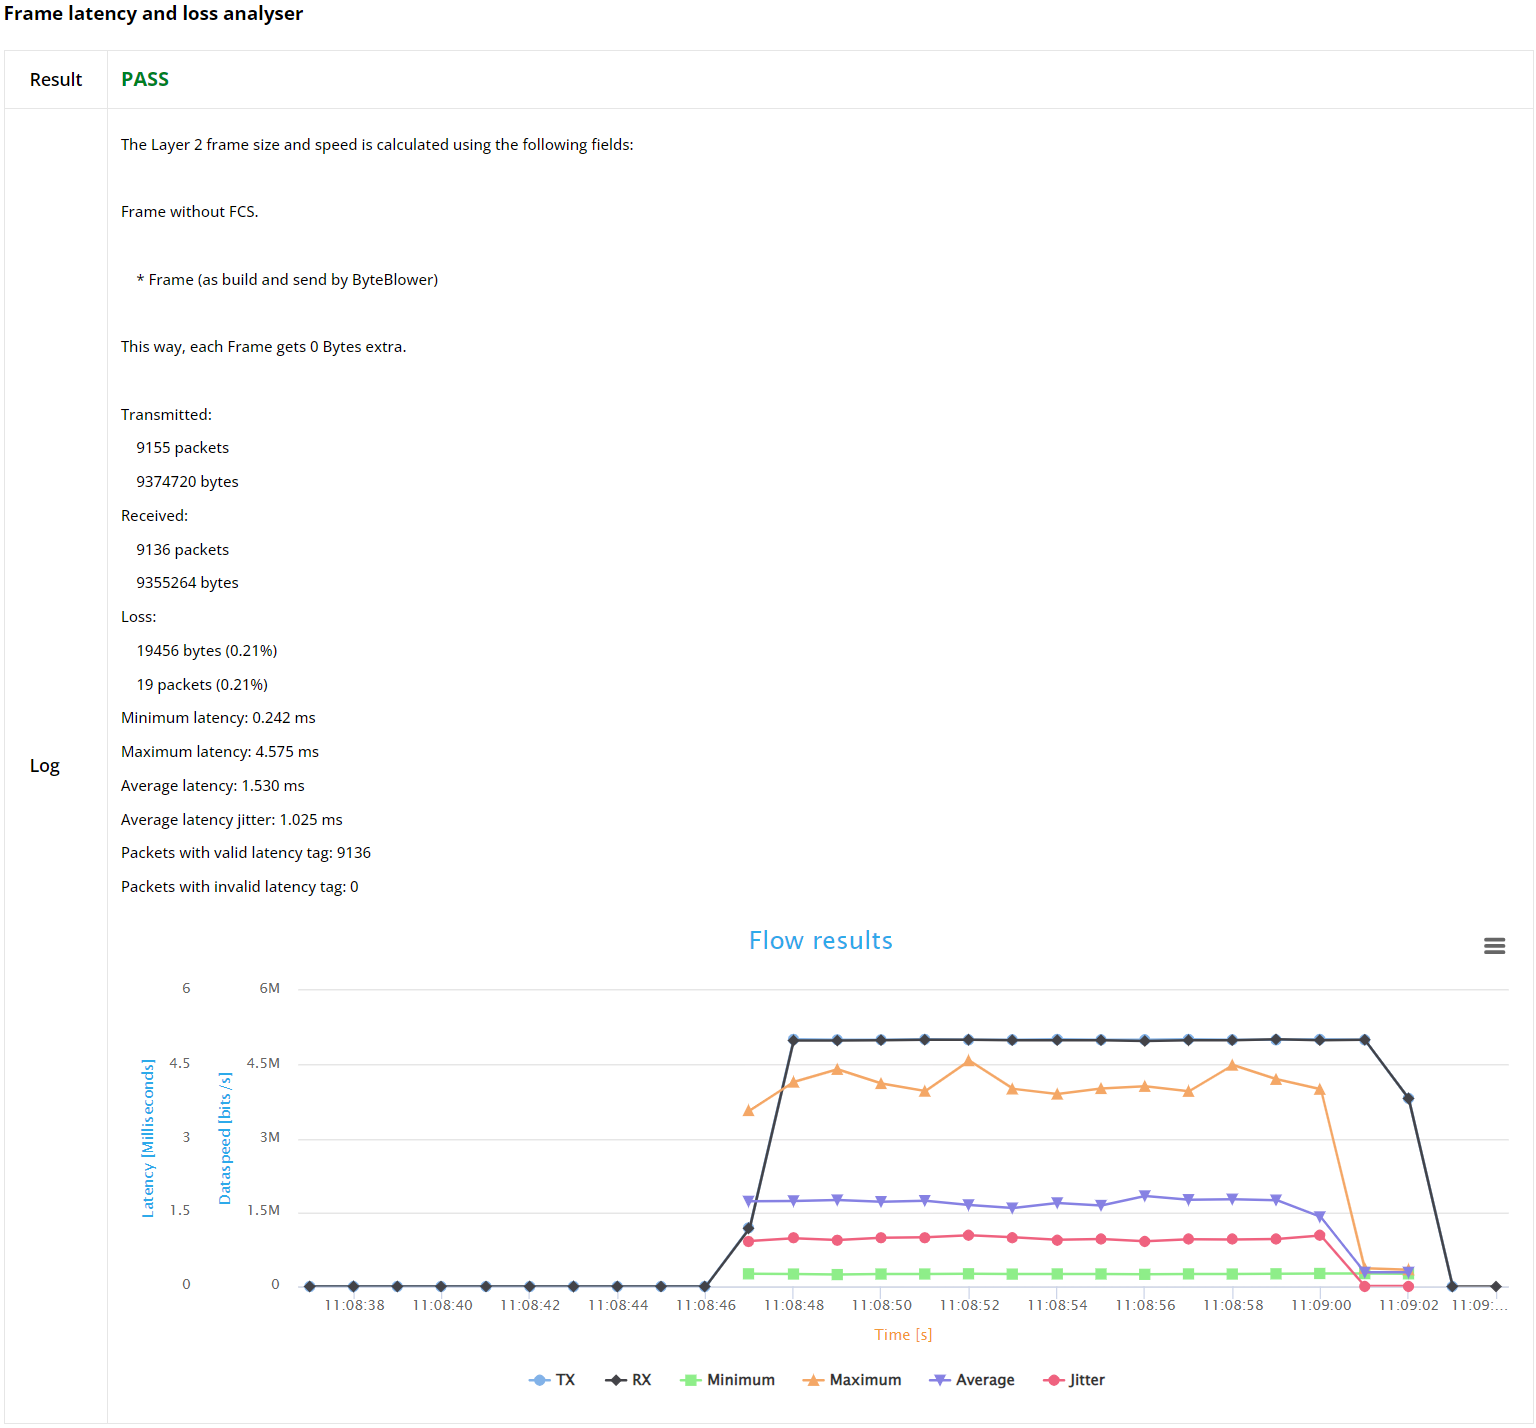
Furthermore, the report features latency over time and Frame Latency Cumulative Distribution Function (CDF) and CCDF graphs, visually representing the latency trends and offering a clear, analytical perspective of the network performance.
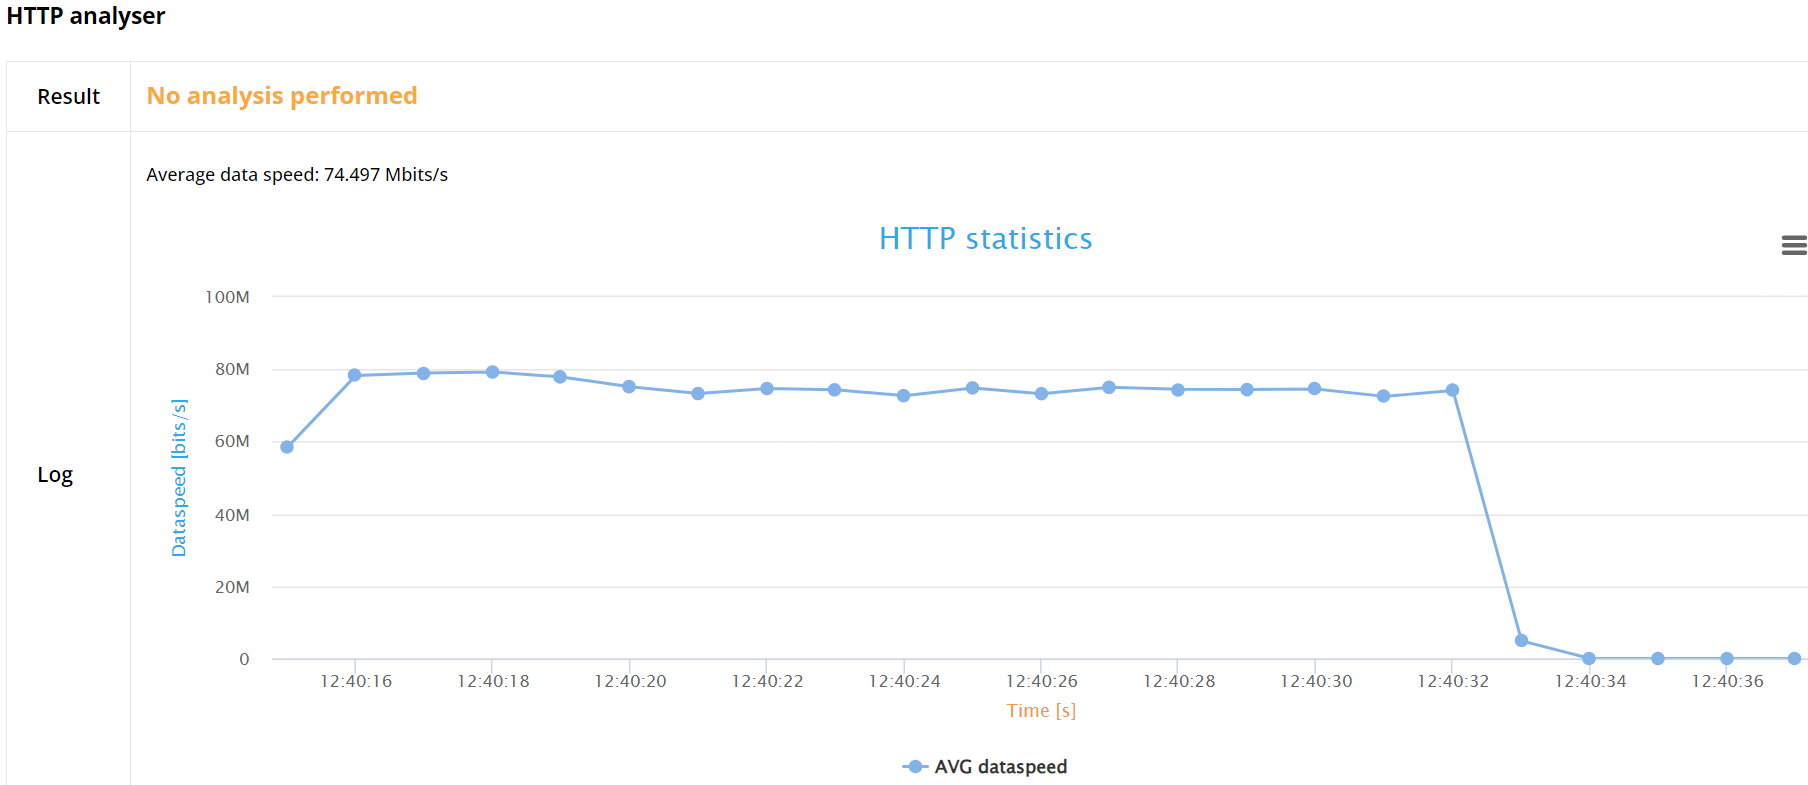
For TCP based flows, namely the HTTP flow, this release provides only the average HTTP goodput (layer 5 data speed).
JSON report
The JSON file is structured to offer an in-depth analysis of a network performance test. It starts with meta-information including API version, test framework version, and timestamps marking the start and end of the test. The main content is divided into sections detailing configuration settings, summary results, and individual flow analyses.
Configuration
This section outlines the test environment and configuration parameters, and the overall test status.
Summary
This portion provides an aggregated view of the test results. It includes the overall status (pass/fail) and detailed metrics for different used ports. Each port section contains:
Status of the test for the particular pathway.
Packet transmission data including timestamps for the first and last packets sent and received, total packets and bytes.
Latency statistics such as minimum, maximum, average latency, and jitter.
Individual Flow Analysis
This section breaks down the performance of each specific flow in the test. It includes:
Flow name and type
Source and destination information.
Status of the flow (pass/fail) and reasons for failure if any.
Detailed analysis including :
Packet transmission details (timing, count, and size of packets sent and received).
Over time results, providing a detailed breakdown of packets sent and received at each timestamp.
For Frame blasting flows, when latency analysis is enabled, it also includes Latency distribution and jitter metrics.
The file meticulously presents both a high-level summary and an intricate, timestamped detailed results for each flow, offering comprehensive insights for evaluating network performance and diagnosing issues.