Result highlights
HTML report
Summary and configuration
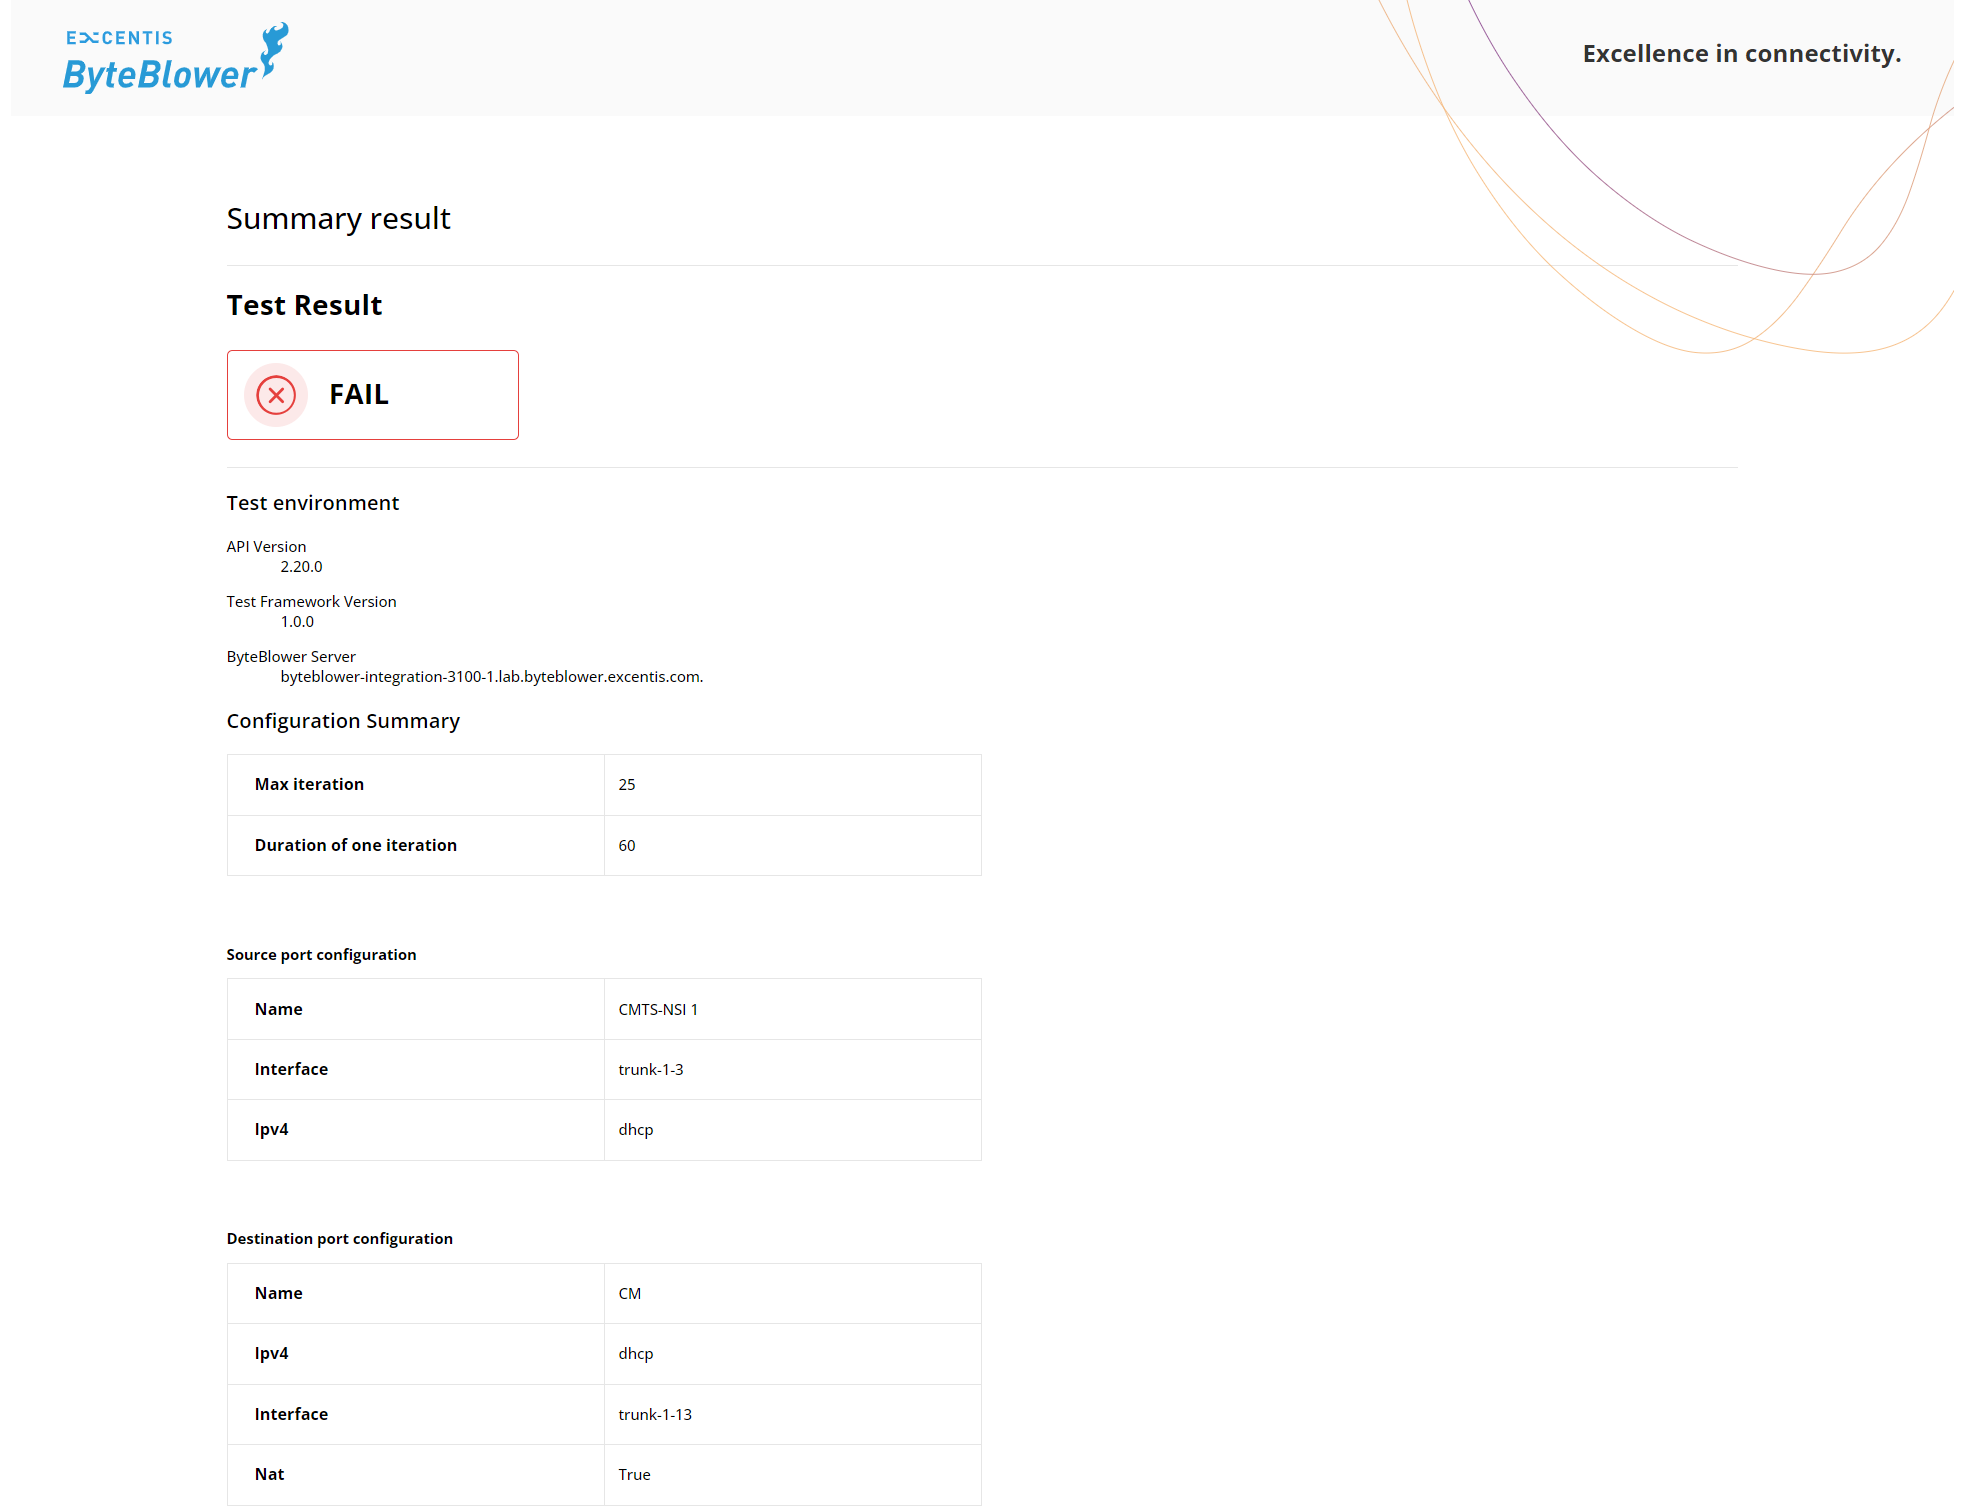
The HTML report begins with a summary of the test setup. Starting with the test status, then summarizing the test environment/configuration. The failed status appears when at least a test status of a frame size is set to failed (more details are provided in the next sub-section).
Results Summary
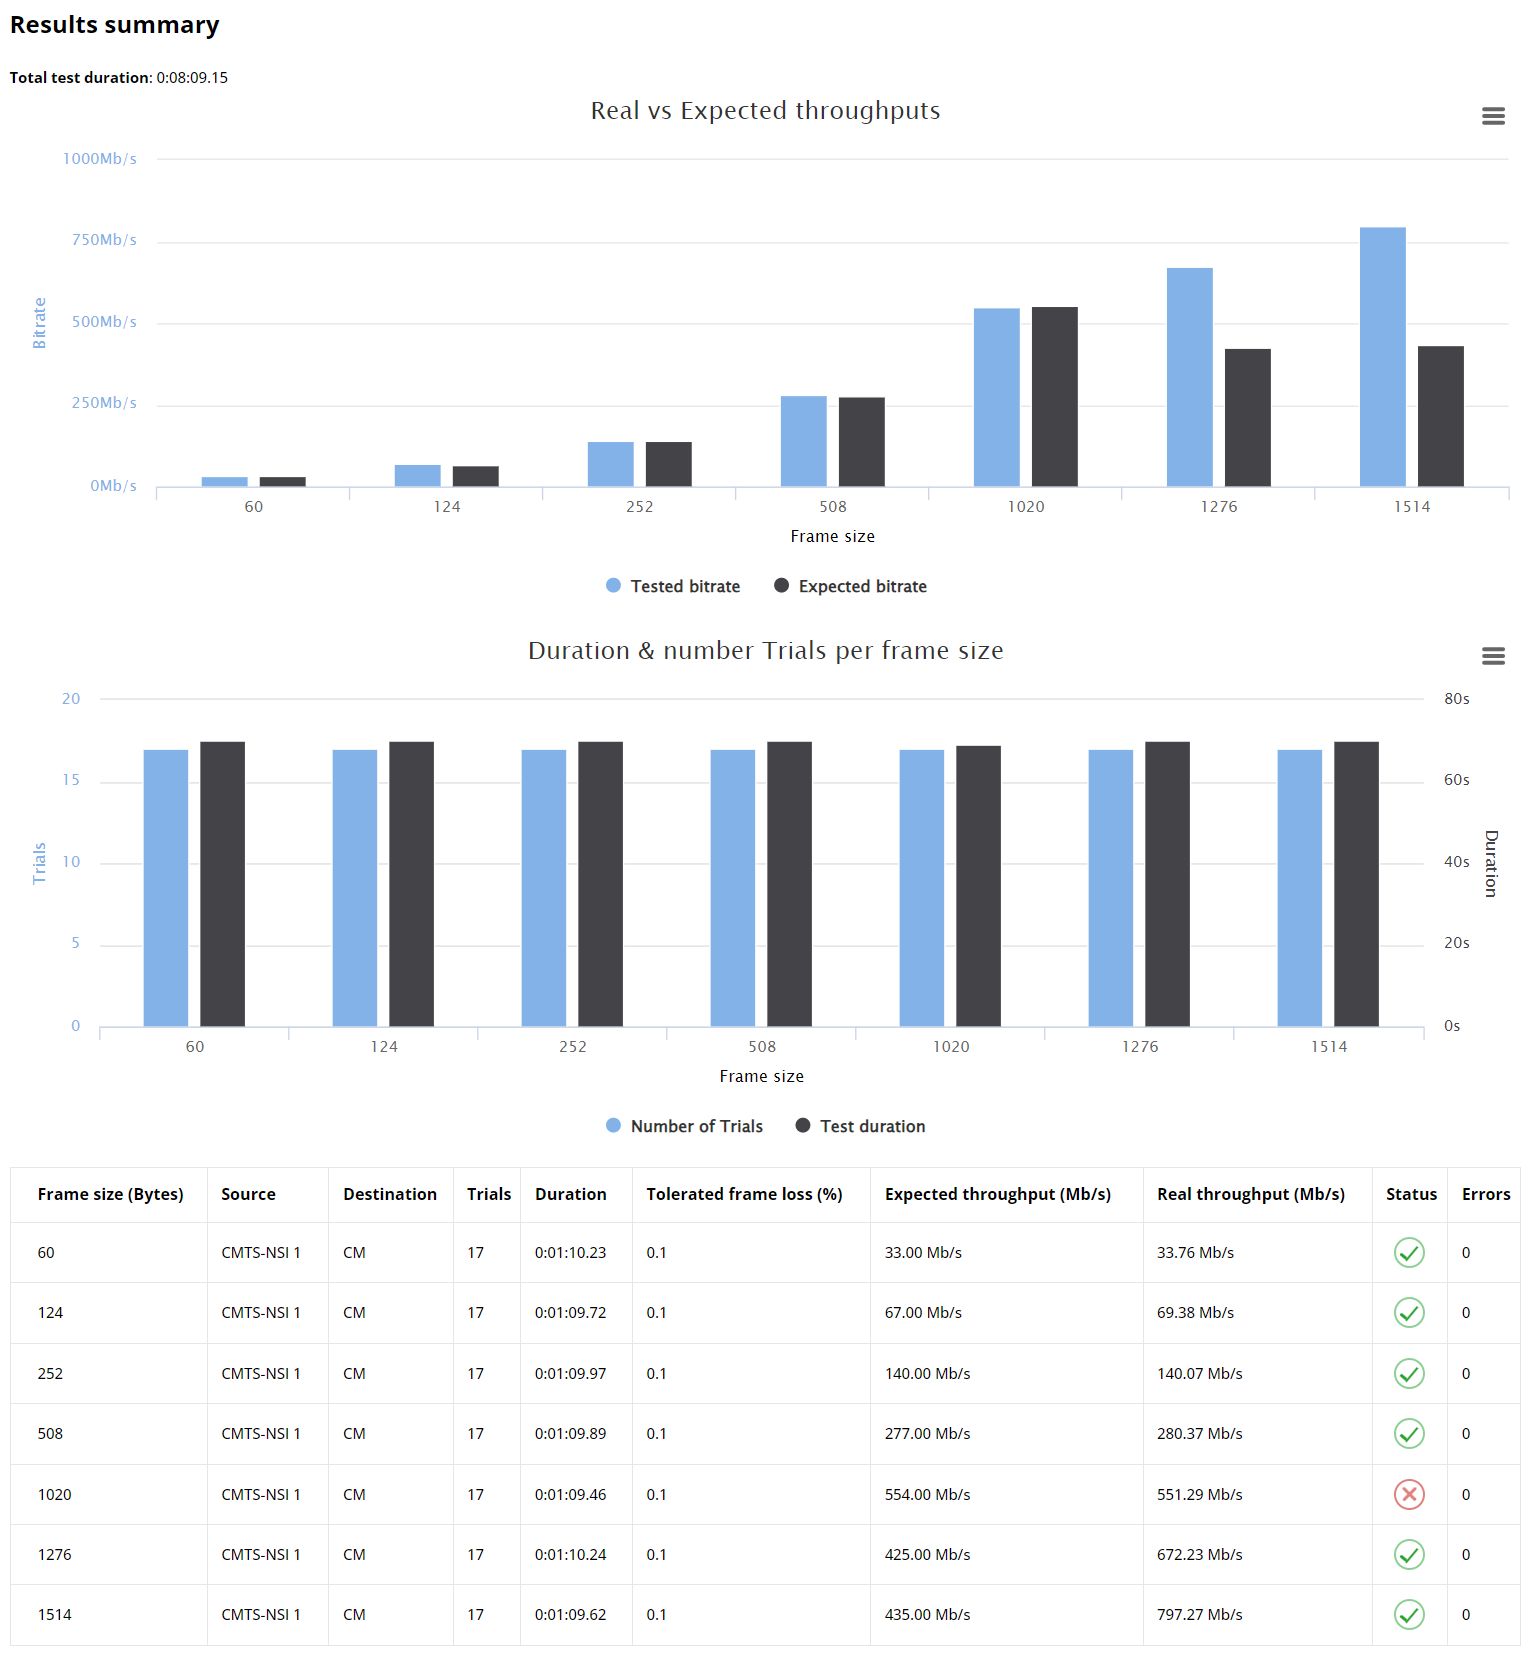
This part presents a concise overview of the aggregate findings from tests conducted on all the frames sizes:
Histogram of the maximum Ethernet layer 2 tested throughput Vs expected maximum throughput for each frame size. Please note that, as mentioned before, this speed is calculated for frames without including the FCS.
Histogram of number trials and test duration (in seconds) for each frame size.
Summary table of all tests’ results. This summary table include the frame size without FCS, Source & Destination, Duration of the test, tolerated frame loss (in %), the expected/real maximum Ethernet layer 2 throughput, number of runtime errors, and the status of this test. A test is considered as failed if:
A runtime error occurs and interrupts the execution (for example, configuration file error, ByteBlower server went down, detecting duplicate frames which causes that trial to be rerun more time than allowed, …). In case an error appears but the trial rerun and the rest of the test end successfully, the error count is increased (details of the error in the error log part), but the status of the test is decided based on the throughput findings only.
At least one frame results is less than expected (the maximum Ethernet layer 2 tested throughput is less than expected)
Else, the test has finished successfully. You can click on the Status icon to be redirected to detailed results for the frame size of your choice.
Frame results (HTML)
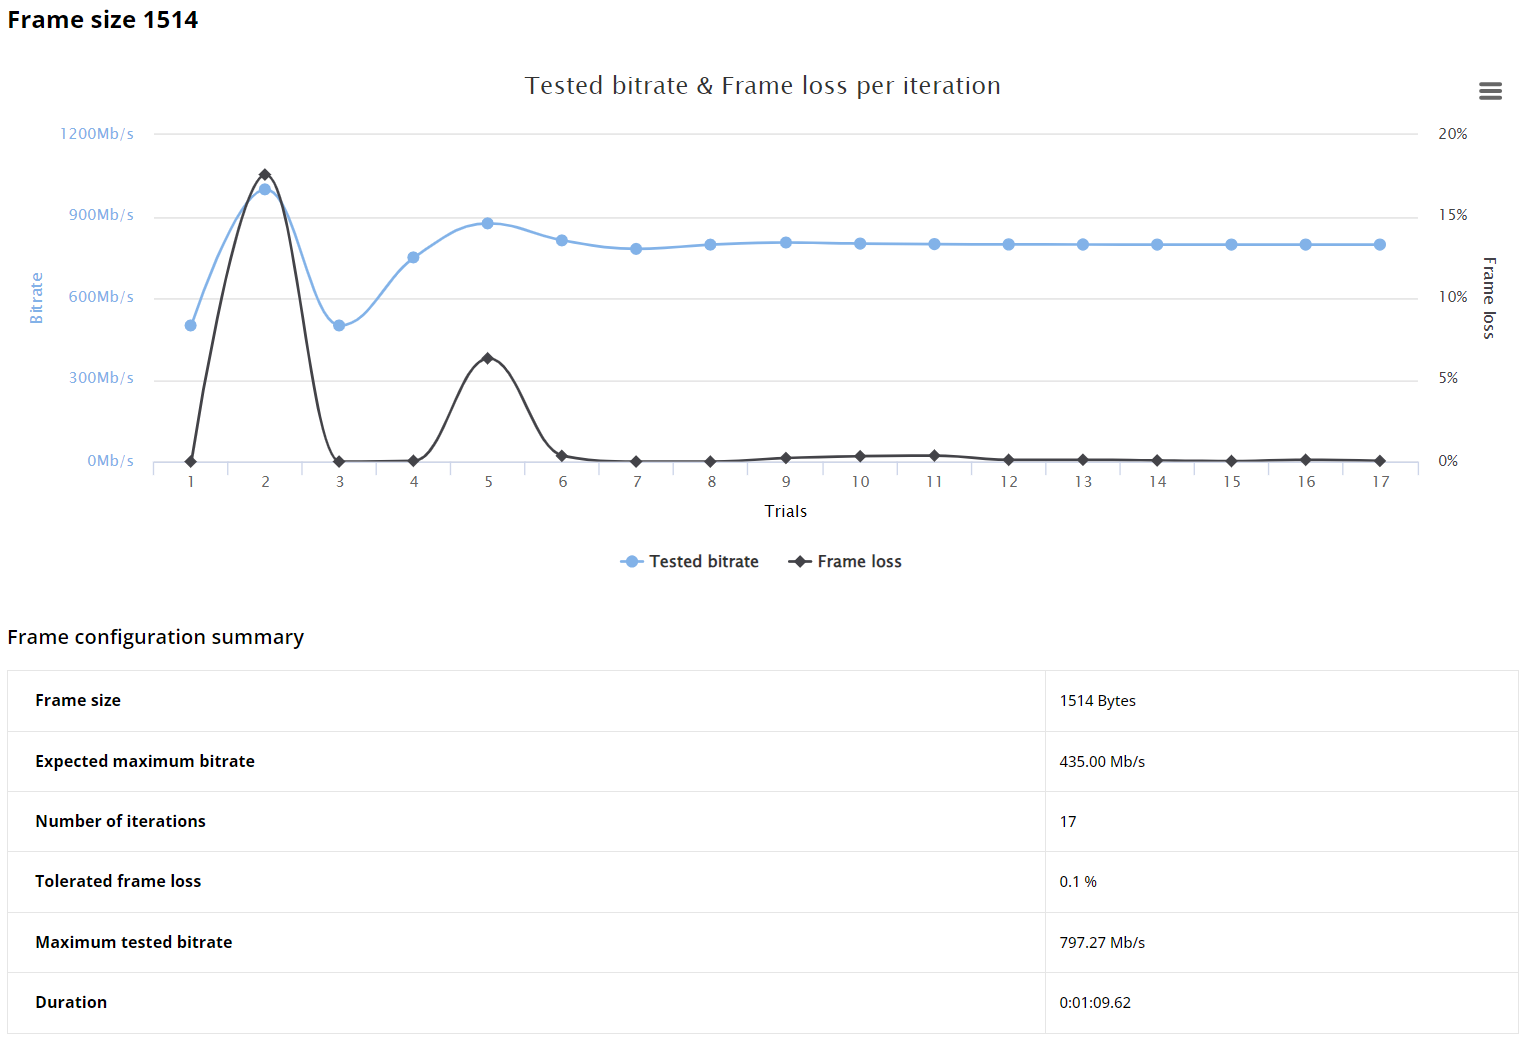
The third part of the report details the results for each frame size, with a graph depicting how tested bitrate and frame loss vary over test trials, in addition to a table containing the frame configuration, maximum Ethernet layer 2 tested throughput and test duration.
Error logs (HTML)
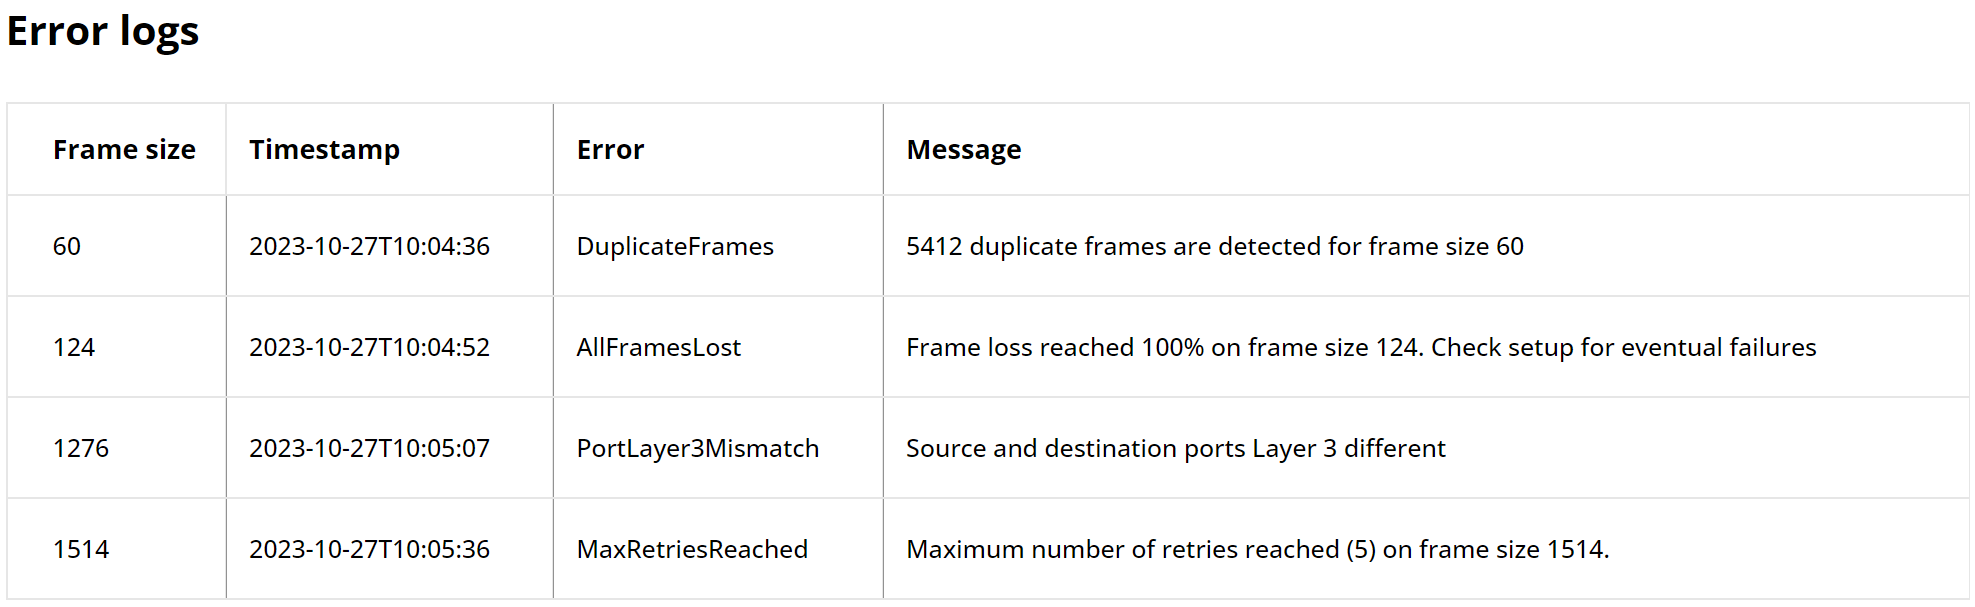
This part could be present to highlight logs of the runtime error that may occur, which are ordered in a table by frame size and timestamp. These logs precise the error type and it’s message that provides details about the cause of the error.
JSON result file
Ths JSON file consists of 3 main parts in addition to the “status” field, which indicates if the execution completed correctly.
Configuration
This part contain the ByteBlower server host name and both used endpoints for the test (as detailed in Test scenario definition)
{
    "configuration": {
        "server": "byteblower-integration-3100-1.lab.byteblower.excentis.com.",
        "source": {
            "name": "Source",
            "interface": "trunk-1-3",
            "ipv4": "172.16.0.50",
            "gateway": "172.16.0.1",
            "netmask": "255.252.0.0"
        },
        "destination": {
            "name": "Destination",
            "interface": "trunk-1-13",
            "ipv4": "dhcp",
            "nat": true
        }
    }
}
Frame results (JSON)
In here, you can find a lit of detailed frame results grouped by frame size. For each frame size, it provides at first the used frame configuration. Then, we have all trial result, where we find, for each trial:
bitrate: The tested bitrate in bits/s
passed: the status of the test (whether the frame_loss <= tolerated_frame_loss)
tx_packets: Count of transmitted packets
rx_packets: Count of received packets
timestamp: Marks when the trial ended (in ISO 8601 format)
duration: Duration of the test in seconds
Finally, you can find the real_bitrate, which is the last tested bitrate before reaching the required accuracy, the maximum number of iterations allowed per frame size, or the maximum number of retries allowed on runtime errors.
{
    "frame": [
        {
            "size": 60,
            "tolerated_frame_loss": 0.001,
            "expected_bitrate": 33000000.0,
            "trials": [
                {
                    "bitrate": 40000000.0,
                    "passed": false,
                    "tx_packets": 166666,
                    "rx_packets": 140170,
                    "timestamp": "2023-10-25T08:35:47.087Z",
                    "duration": "P0DT0H0M3.112934S"
                },
                {
                    "bitrate": 20000000.0,
                    "passed": false,
                    "tx_packets": 83333,
                    "rx_packets": 83026,
                    "timestamp": "2023-10-25T08:35:50.176Z",
                    "duration": "P0DT0H0M3.088299S"
                },
                {
                    "bitrate": 10000000.0,
                    "passed": true,
                    "tx_packets": 41666,
                    "rx_packets": 41666,
                    "timestamp": "2023-10-25T08:35:53.290Z",
                    "duration": "P0DT0H0M3.113552S"
                },
                {
                    "bitrate": 15000000.0,
                    "passed": true,
                    "tx_packets": 62500,
                    "rx_packets": 62500,
                    "timestamp": "2023-10-25T08:35:56.371Z",
                    "duration": "P0DT0H0M3.080543S"
                }
            ],
            "real_bitrate": 15000000.0,
            "test_duration": "P0DT0H0M12.397639S"
        }
    ]
}
Error logs (JSON)
In the event of runtime errors, error logs are saved in here to assist find the causes, and eventually try to avoid them in the future. Errors logs are also gathered by frame size and ordered by timestamp.
Each item contains:
Exception type
Error message giving more details about what went wrong
Timestamp of when the error happened
{
    "error_logs": {
       "60": [
          {
                "exception": "DuplicateFrames",
                "error_msg": {
                   "args": [
                      "5412 duplicate frames are detected for frame size 60"
                   ]
                },
                "timestamp": "2023-10-27T10:04:36.956"
          }
       ],
       "124": [
          {
                "exception": "AllFramesLost",
                "error_msg": {
                   "args": [
                      "Frame loss reached 100% on frame size 124. Check setup for eventual failures"
                   ]
                },
                "timestamp": "2023-10-27T10:04:52.693"
          }
       ],
       "1276": [
          {
                "exception": "PortLayer3Mismatch",
                "error_msg": {
                   "args": [
                      "Source and destination ports Layer 3 different"
                   ]
                },
                "timestamp": "2023-10-27T10:05:07.900"
          }
       ],
       "1514": [
          {
                "exception": "MaxRetriesReached",
                "error_msg": {
                   "args": [
                      "Maximum number of retries reached (5) on frame size 1514."
                   ]
                },
                "timestamp": "2023-10-27T10:05:23.123"
          }
       ]
    }
}