Example: DOCSIS 4.0 ATP
Test Scenario Definition
This test scenario is designed to verify the DOCSIS PIE AQM behavior in the presence and absence of LLD traffic and evaluate the delay estimator.
The test has two procedures to run:
Procedure 1: CM follows the DOCSIS PIE AQM Algorithm, with no traffic on LL SF
Procedure 2: CM follows the DOCSIS PIE AQM Algorithm, with traffic on LL SF
The configuration for this scenario includes two types of traffic:
Classic Flow: Used in both procedures
LLD Flow: Used in the second procedure to observe its effect on the Classic flows
The frame rate for each flow is different and is specified by the ATP.
A detailed analysis of the results is generated.
Run a test
The traffic test scenario can be run via command-line interface. You can use the following steps:
Create a working directory and (preferably) a Python virtual environment within.
Activate the virtual environment and install the ByteBlower Test Case.
Copy the example files into your working directory:
Update the example file to your own test setup (ByteBlower server, ByteBlower port configuration, etc.)
Run the test from your working directory using the command line interface:
byteblower-test-cases-docsis-atp-mulpi-v4-0-ll-04-40-part1
python -m byteblower.test_cases.docsis_atp.mulpi_v4_0.ll_04_40.part1
More details regarding these steps are given in Installation & Quick start.
Result highlights
HTML report
Test Result
The HTML report begins with a summary of the test setup. Starting with the test status, then summarizing the test environment/configuration. The FAIL status appears when at least one of the pass/fail criteria parameters is not met.

Results Summary
The results of the test are displayed per procedure. Each procedure has a table of results and two graphs, one packet loss percentage per interval graph, and pne latency per interval graph.
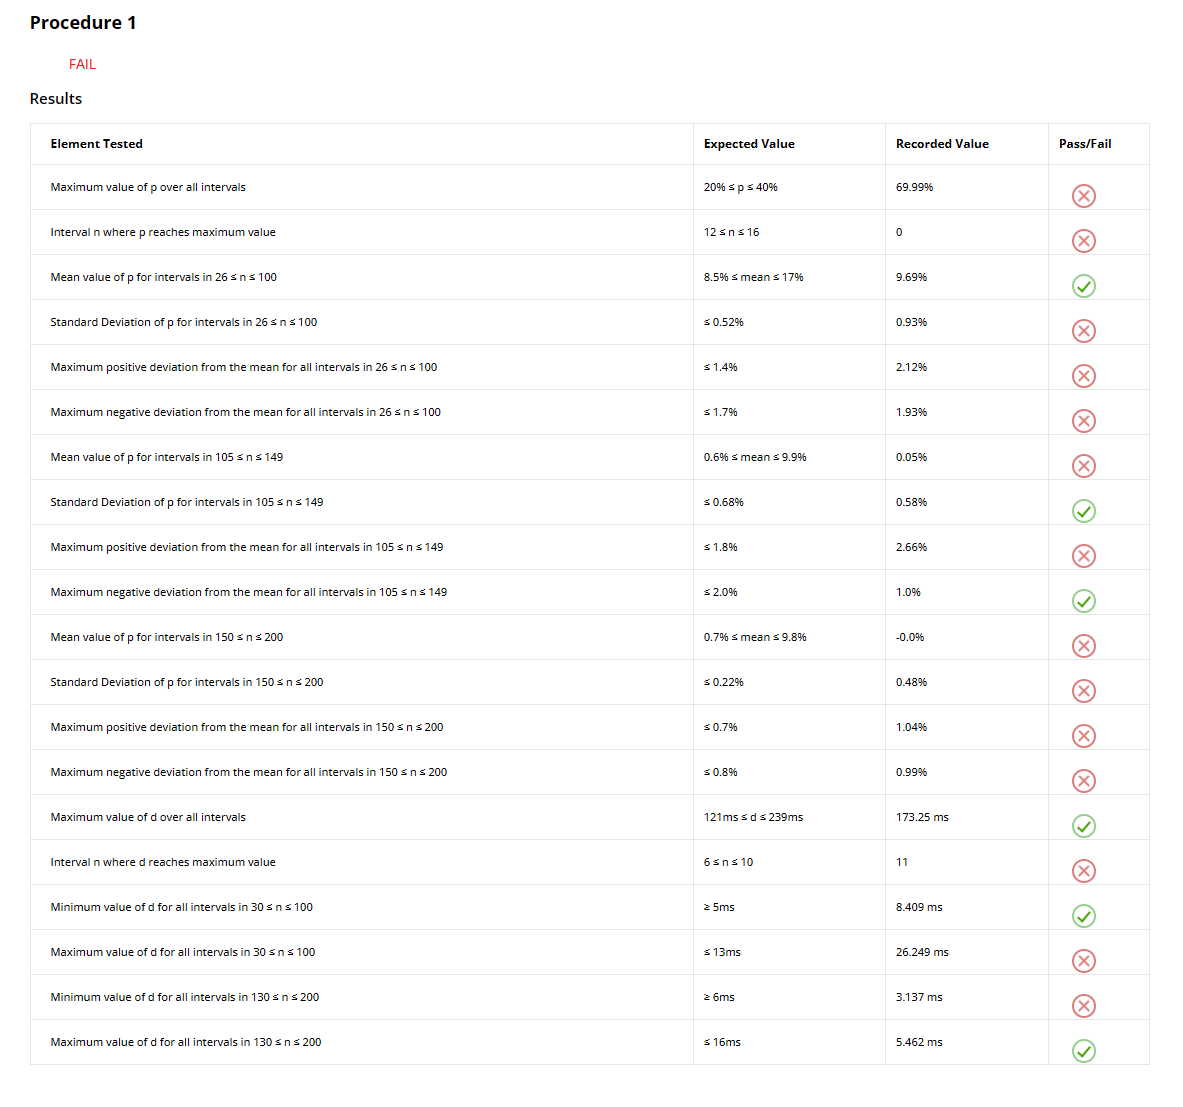
The table of results is processed from the packet loss and latency results of the flows that were run in that procedure. It provides a clear indication on whether that test point has passed or failed based on the requirements set by the ATP.
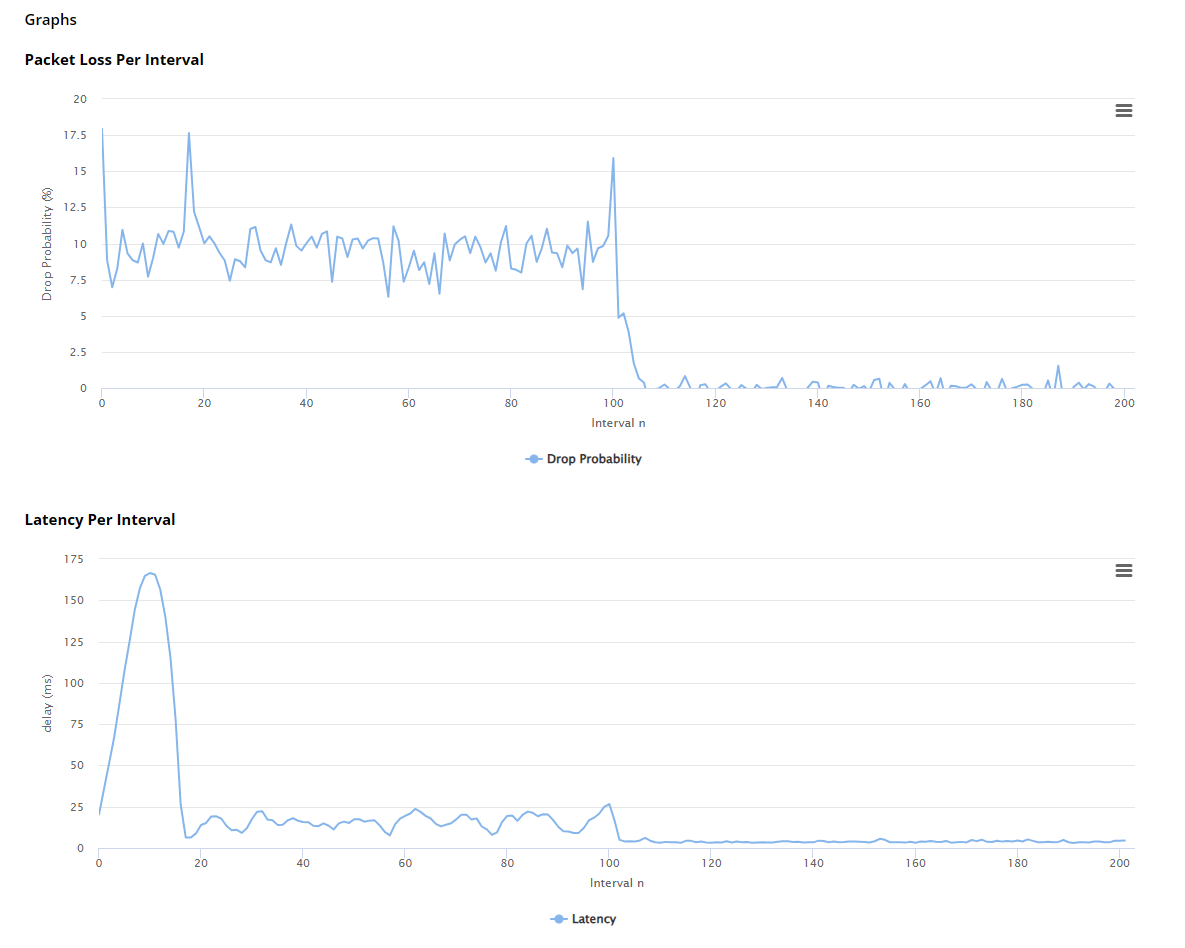
The graphs are a visual representation of the packet loss and latency per interval data for the two Classic flows.