Example: L4S
Test Scenario Definition
The intention of this scenario is to analyze the impact that high-volume UDP traffic, acting as background noise, has on the performance and dependability of both classic and L4S-enhanced HTTP traffic. By closely monitoring metrics such as latency, retransmissions, and throughput, the test aims to reveal the network’s behavior under heavy congestion. To this end, we use and examine the behavior of three distinct traffic flows under varying load conditions:
Classic HTTP Flow: This traffic flow emulates standard web activity, providing a baseline for network performance under typical conditions.
L4S HTTP Flow: Running in parallel with the classic HTTP flow, this flow tests a more sophisticated traffic handling method that aims to maintain low latency and loss even in congested environments.
UDP Background Flow: Temporarily introduced during the test, this flow creates a high-load situation, creating congestion to observe its influence on the classic and L4S HTTP flows.
The resulting data will demonstrate the differential behaviors between classic and L4S traffic, particularly how Low Latency, Low Loss, Scalable throughput technology enhances throughput, reduces latency, and improves the overall reliability of the flows. The results will also guide network optimization efforts, aiming to enhance the balance between traffic handling efficiency and service quality.
The L4S implementation in ByteBlower is based on the Explicit Congestion Notification (ECN) Protocol for Low Latency, Low Loss, and Scalable Throughput (L4S), More Accurate Explicit Congestion Notification (ECN) Feedback in TCP and Prague Congestion Control.
Tip
Changing a classic HTTP flow into an L4S-enabled HTTP flow requires nothing more than the following entry in the flow definition:
{
    "enable_l4s": true
}
Run a test
Using the ByteBlower Test Framework, the traffic test scenario can be run via command-line interface. You can use the following steps:
Create a working directory and (preferably) a Python virtual environment within.
Activate the virtual environment and install the ByteBlower Test Framework.
Copy one of these example files into your working directory (based on what you want to test):
Update the example file to your own test setup (ByteBlower server, port/endpoint configuration, etc.)
Run the test from your working directory using the command line interface:
byteblower-test-framework
python -m byteblower_test_framework
More details regarding these steps are given in Installation & Quick start.
Result Highlights
In this section, we explain the structure of the HTML report, and how to interpret the findings.
Test status & environment
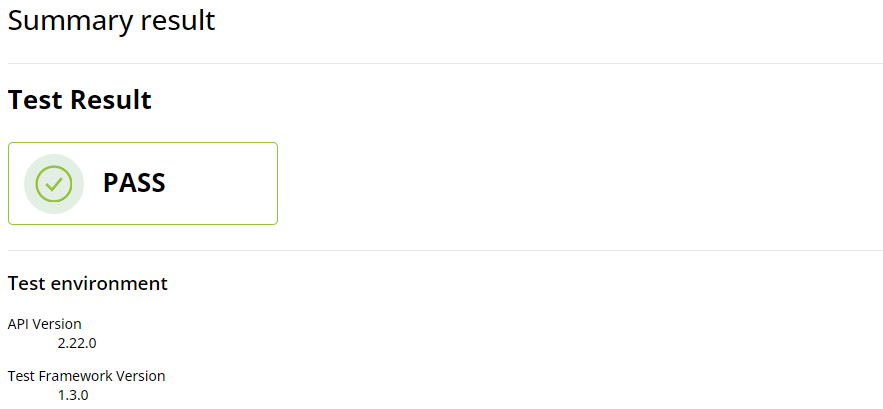
The first part of the report contains the overall test status, which indicates whether the network performance met or failed the predefined requirements. These requirements typically include maximum tolerated packet loss and latency thresholds, among others. A test is considered as failed if at least one flow status is FAIL (the actual failure cause(s) are indicated in the individual flow results).
The test environment section provides essential details on the API and the ByteBlower Test Framework versions used for the test. In this instance, API version 2.22.0 and ByteBlower Test Framework version 1.3.0 were used.
Ports and config
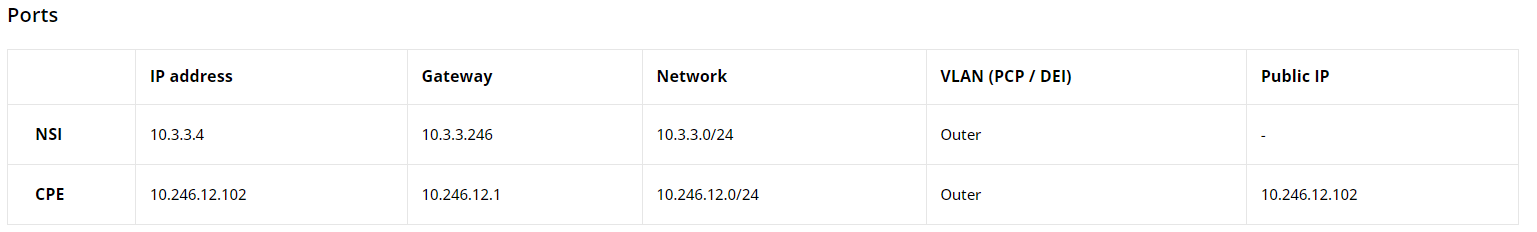
Next, you will find the port configuration table that outlines the setup of the network ports involved in the test, including IP addresses, network masks, gateways, etc.
Individual test results
The individual test results part contains the following information:
Downstream Classic HTTP Test Results
This section presents the results of the HTTP traffic analysis.
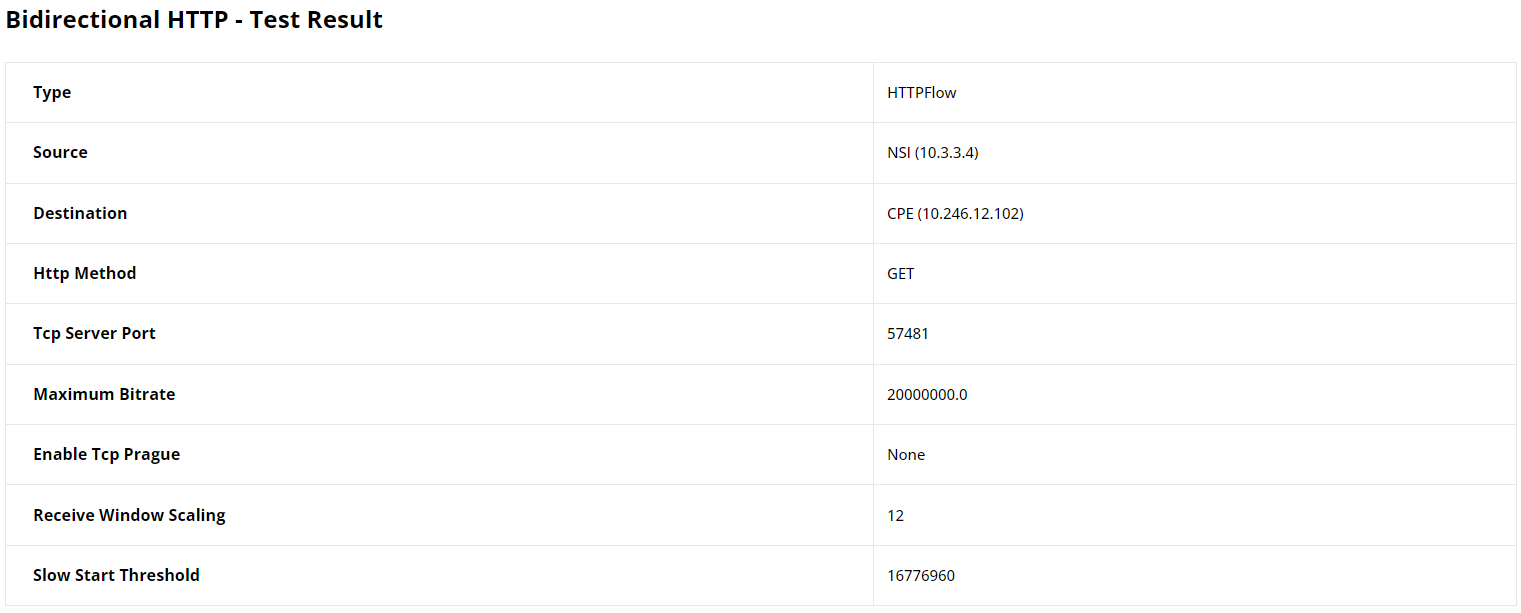
The results section begins with a configuration table of the HTTP flow,
detailing the source and destination addresses, the HTTP method used (GET),
the TCP server port, and other settings such as the maximum bitrate and TCP
window scaling factors. These details provide the context needed to evaluate
the HTTP traffic performance within the test.
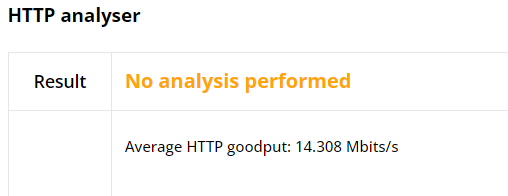
This section illustrates Basic HTTP flow results. Currently, we do not provide
key performance metrics (KPI) post-processing of HTTP test results. That’s
why No analysis performed is shown in the report. However, we do provide the
average HTTP goodput throughout the test as shown in the figure below.
This value (14.308 Mbits/s) is 25% lower than the configured maximum speed,
which represents a considerable decrease in goodput.
Finally, the HTTP Statistics graph illustrates key performance metrics such as throughput, goodput, retransmissions, and round-trip time, providing insight into the network’s efficiency and stability in handling web traffic over time. The goodput shows the actual application-level throughput, retransmissions point to loss or errors, while round-trip time indicates the network’s latency.
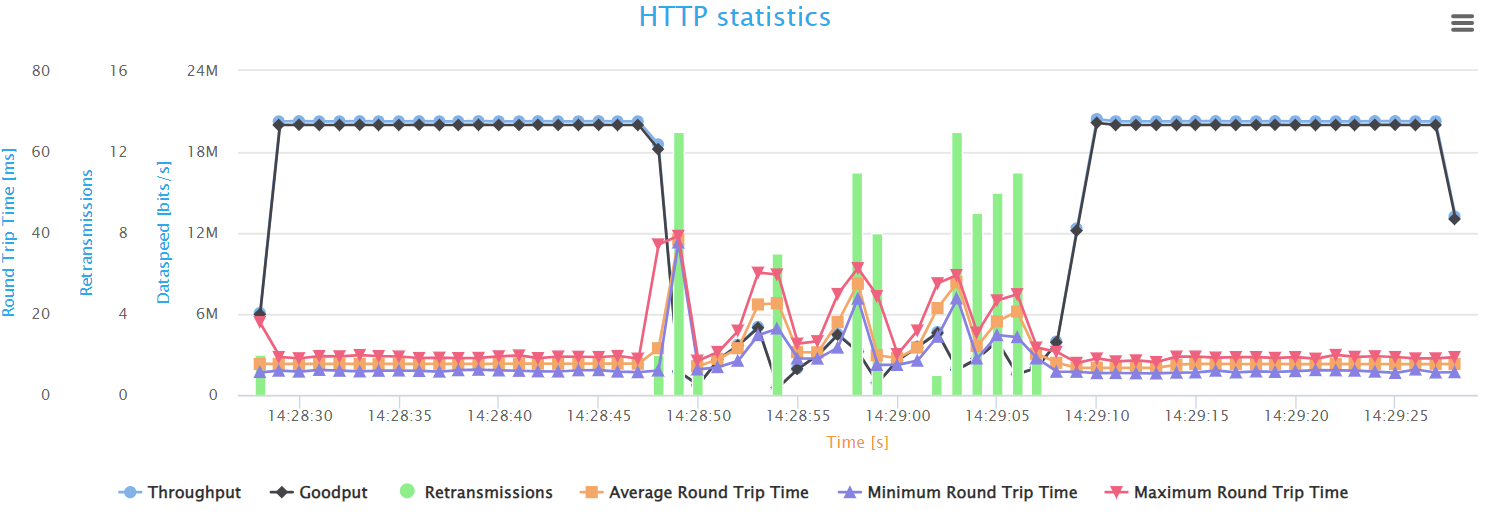
The graph provides a snapshot of the HTTP flow behavior during the test. Initially, the network shows optimal performance with the highest possible throughput and minimal latency, indicating a smooth flow of HTTP traffic. However, once the UDP background traffic begins at the 20-second mark, we can see that the throughput and goodput have decreased tremendously. In addition, these speeds fluctuate up and down during this phase. indicating unstable behavior of the HTTP flow, and the network is struggling to handle the extra data properly.
Alongside these changes, there’s a significant increase in latency, as shown
by the spikes in Round-Trip Time (RTT) measurements. This rise in RTT,
coupled with an increase in retransmissions, indicates that packets are either
lost or taking longer to be confirmed as received, which can lead to delays and
reduced data transfer efficiency. Once the extra UDP traffic stops, the HTTP
flow metrics quickly go back to their original high-speed, low-delay state.
This period of congestion demonstrates the susceptibility of classic HTTP traffic to high loads on the network, which gives valuable insights to help in tuning the system to maintain high service levels during peak times.
Downstream L4S HTTP Test Results
This section presents the results of the L4S HTTP traffic analysis.
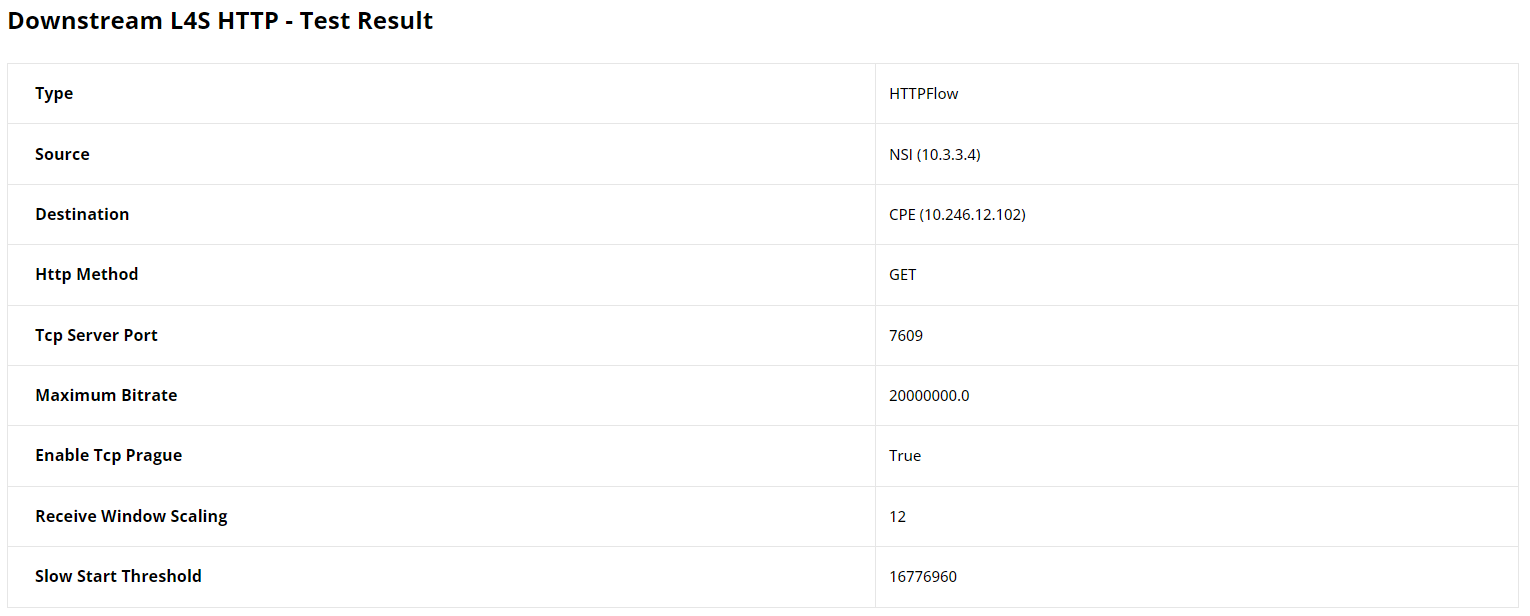
The results section is similar to the classic HTTP flow and it starts with a
configuration table of the L4S HTTP flow, listing the source and destination
addresses, the HTTP method used (in this case: GET method), the TCP server
port, and other settings.
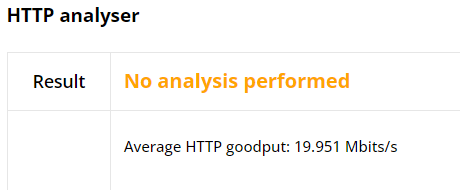
Seemingly, the average HTTP goodput throughout the test is calculated and given as shownow. This value almost matches the maximum speed set for this flow proving that the L4s HTTP flow maintained optimal speed despite the presence of the background UDP flow
The L4S HTTP Statistics graph shows important performance measures similar to
those of classic HTTP, such as: Throughput, goodput, retransmissions, and
round-trip time (RTT). Additionally, it tracks the number of ECN
(Explicit Congestion Notification) markings per second, which indicate the
presence of network congestion through Congestion Experienced (CE)
markings. These CE markings alert the receiver that the sender should take
early action to prevent queue buildup and packet loss, thus maintaining low
latency and smooth throughput.
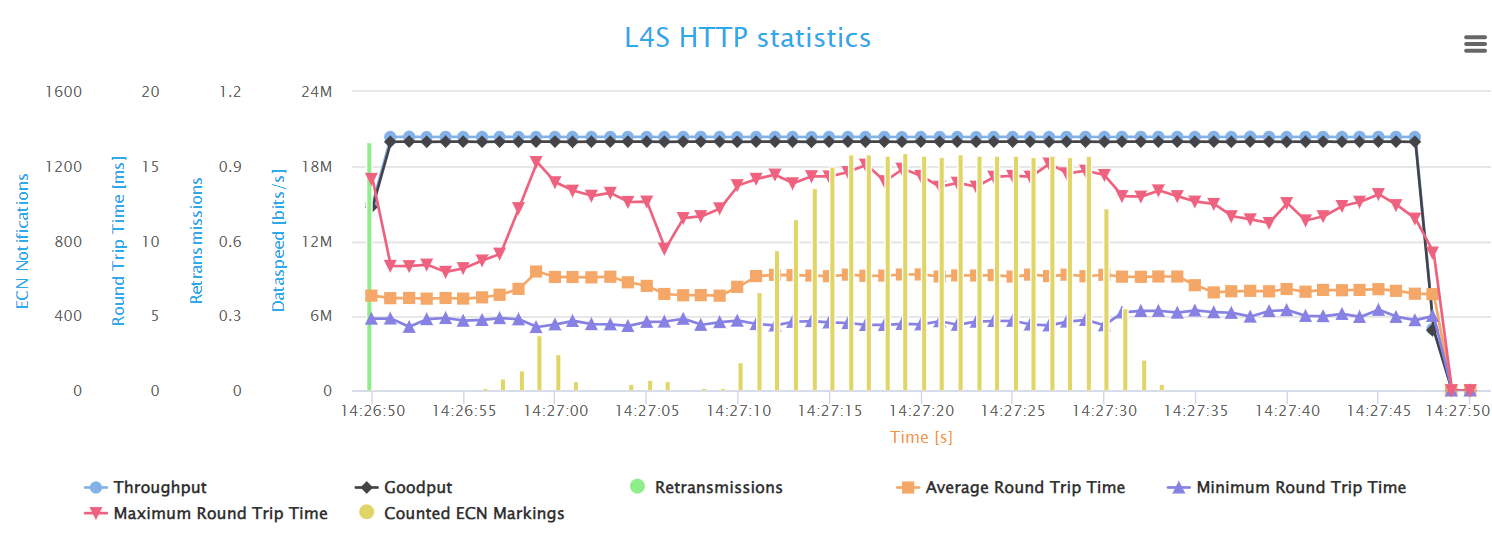
The L4S HTTP statistics graph demonstrates a more stable network performance
compared to the classic HTTP flow. Throughput and goodput levels are
maintained even with increased network traffic, indicating that Low Latency, Low Loss, Scalable throughput
effectively manages congestion. The graph also shows almost no retransmissions,
suggesting that L4S reduces packet loss and maintains data integrity better
than traditional HTTP traffic management. Also, you can see clearly that
latency has only increased slightly during congestion. The average RTT
values went from around 6.5ms to 7.5ms.
Moreover, the presence of ECN markings in the L4S graph points to the L4S advanced congestion control mechanism. This mechanism allows for early detection and handling of congestion, contributing to the overall stability and efficiency of the network. The graph clearly illustrates the benefits of L4S in maintaining consistent high throughput and minimizing latency data retransmissions under heavy network load.
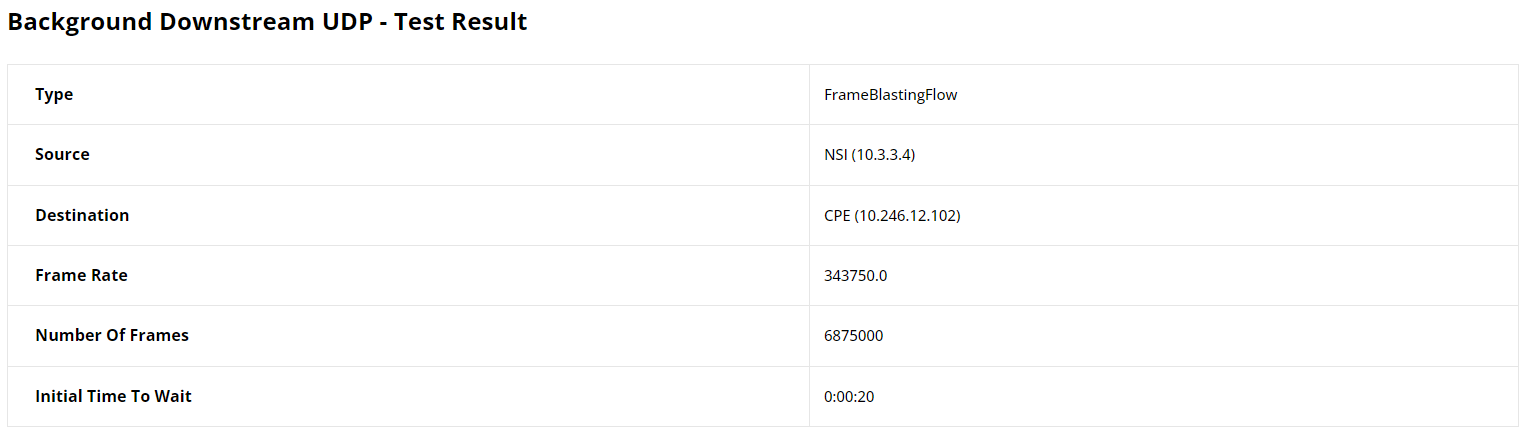
UDP Frame Blasting Test Results
This section provides result statistics for the UDP traffic analysis. This was the flow intended for background load traffic. The results start with a table displaying the configuration of the UDP flow, including source and destination details, frame rate, and the number of frames.
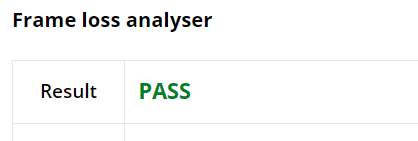
Next, we have the Frame loss analyser which highlights some result statistics concerning transmission and reception. First, we have the test status, which is PASS in this case.
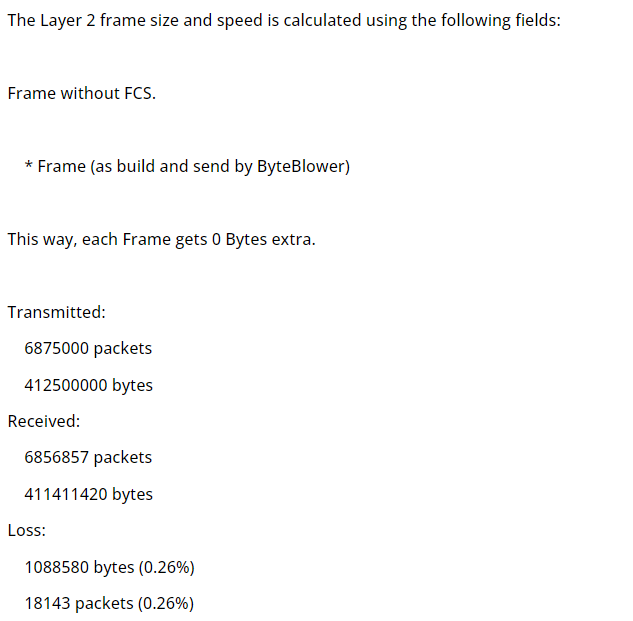
The result summary then unveils some important statistics: The number of packets/bytes transmitted and received, and any packets/bytes losses incurred. These results are pivotal for diagnosing issues related to packet delivery and network congestion.
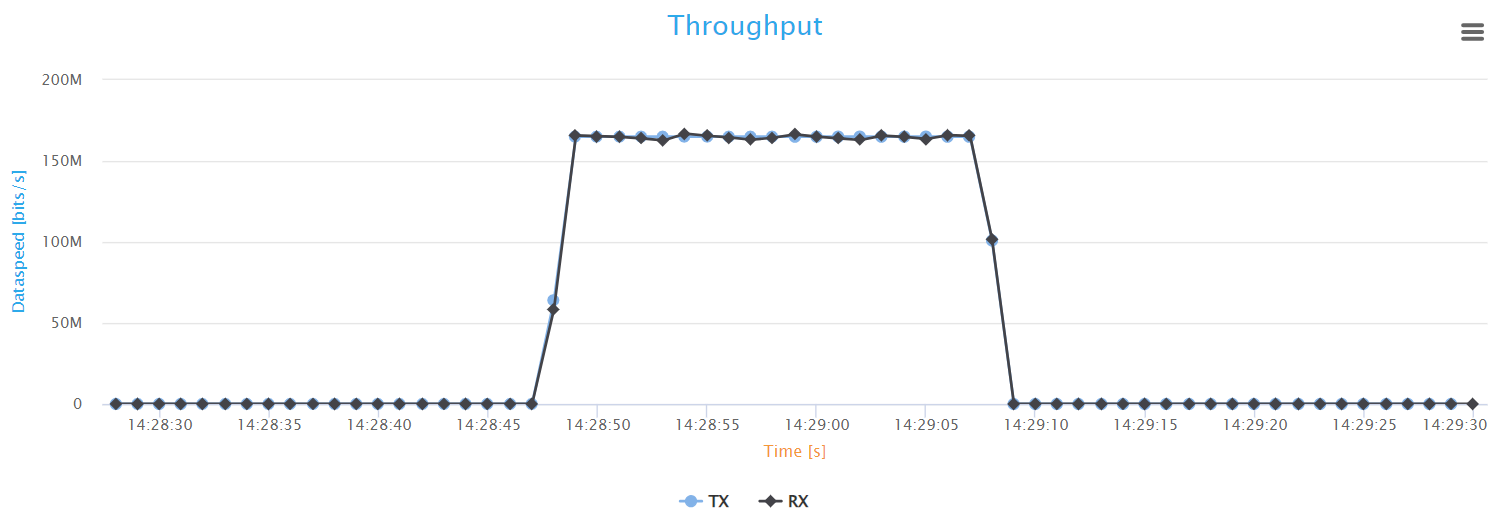
Finally, the report features a graph that illustrates the variation over time of the transmitted (Tx) and received (Rx) throughput.