Example: Low Latency - Basic
Test Scenario Definition
This test scenario is designed to closely mimic real-world network conditions by evaluating the impact of diverse background traffic flows on the performance and reliability of an HTTP flow. This approach aims to provide insights into the network’s capability to sustain high-quality service for critical web traffic in the presence of competing data flows. Such conditions are representative of complex enterprise networks or service provider environments, where a multitude of applications and services concurrently demand network resources.
The configuration for this scenario includes a selection of background traffic types, each having particular patterns and may influence differently the overall network behavior:
Gaming Flow: Simulates the dynamic and interactive traffic generated by basic online gaming applications
Voice Flow: Simulates VoIP services
Basic UDP Flow: Represents high-volume background traffic, typical of streaming, broadcasting, or bulk data transfers, etc.
Throughout the testing period, these flows will be initiated at specified intervals, allowing for a detailed analysis of their cumulative effects on the HTTP traffic. This traffic, representing regular web services, will be continuously monitored to assess the network’s efficiency in managing and prioritizing essential services in the context of diverse and competing traffic types.
Run a test
The traffic test scenario can be run via command-line interface. You can use the following steps:
Create a working directory and (preferably) a Python virtual environment within.
Activate the virtual environment and install the ByteBlower Test Case.
Copy one of these example files into your working directory (based on what you want to test):
Update the example file to your own test setup (ByteBlower server, port/endpoint configuration, etc.)
Run the test from your working directory using the command line interface:
byteblower-test-cases-low-latency
python -m byteblower.test_cases.low_latency
More details regarding these steps are given in Installation & Quick start.
Result Highlights
In this section, we explain the structure of the HTML report, and how to interpret the findings.
Test status & environment
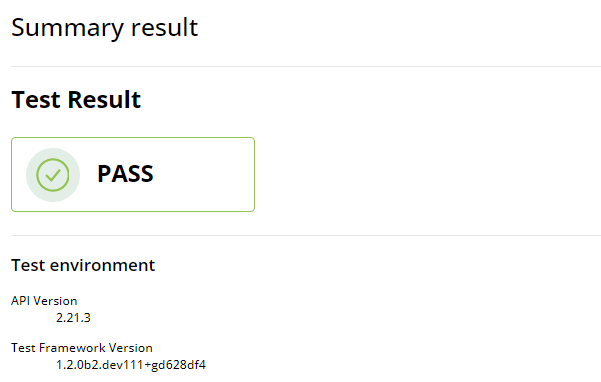
The first part of the report contains the overall test status, which indicates whether the network performance met or failed the predefined requirements. These requirements typically include maximum tolerated packet loss and latency thresholds, among others. A test is considered as failed if at least one flow status is FAIL (the actual failure cause(s) are indicated in the individual flow results).
The test environment section provides essential details on the API and the ByteBlower Test Framework versions used for the test. In this instance, API version 2.22.0 and ByteBlower Test Framework version 1.3.0 were used.
Ports and config
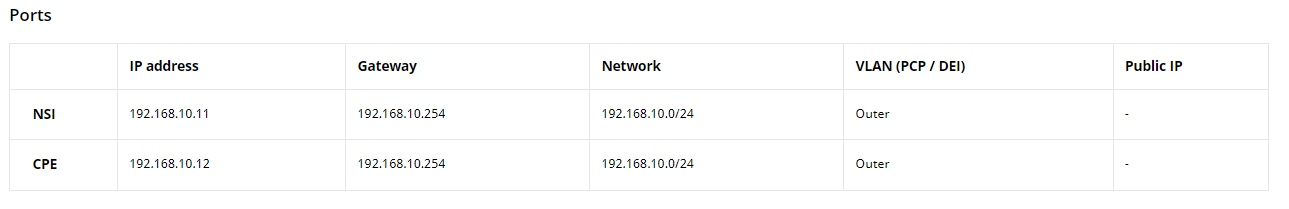
Next, you will find the port configuration table that outlines the setup of the network ports involved in the test, including IP addresses, network masks, gateways, etc.
Correlated test results
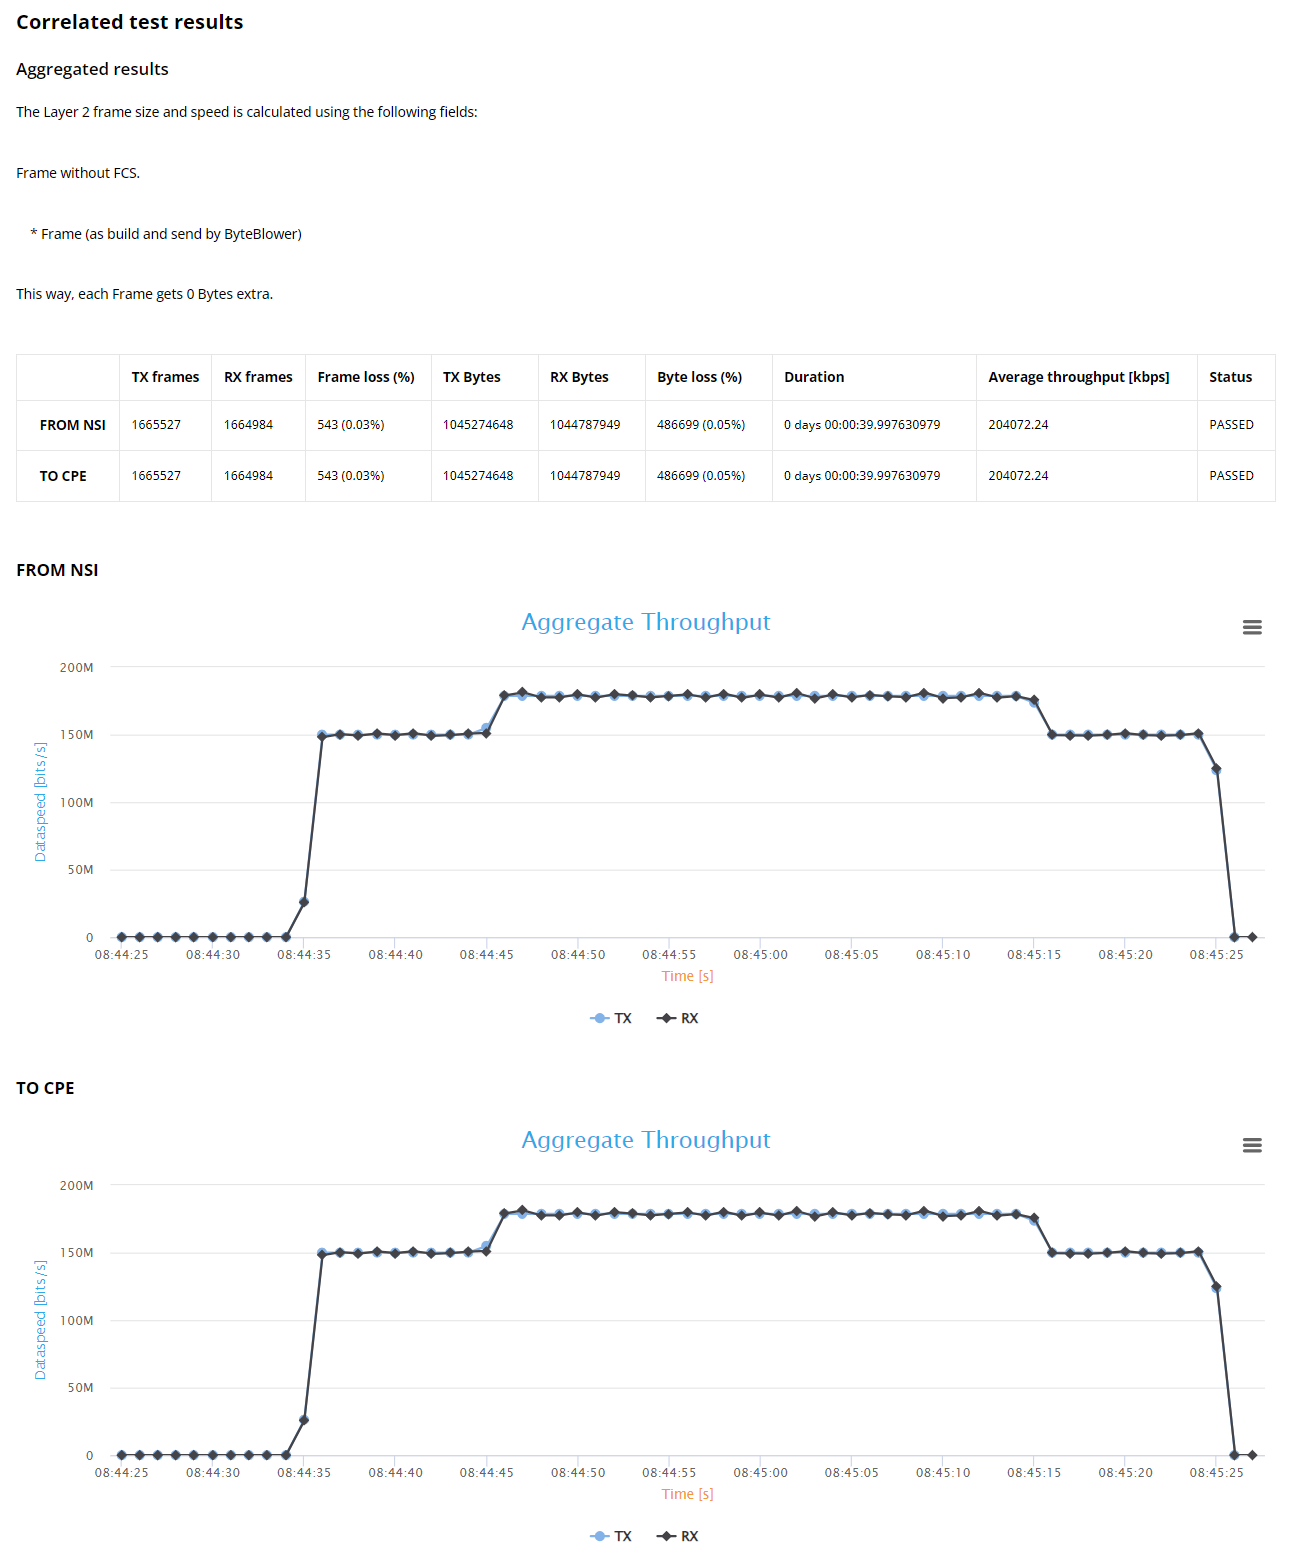
The report then presents the correlated test results, which aggregate the throughput measurements for UDP flows. When multiple flows are used, this section starts with table summarizing transmission (Tx) and reception (Rx) statistics per transmitting/receiving port, including: Tx/Rx frames and Bytes, duration, average throughput, etc. Then, it presents aggregated throughput graphs for each port involved in transmission and reception.
Note
When latency analysis is enabled, this section also includes aggregated latency CCDF results. The CCDF graph indicates the percentage of packets with latencies below or above specific latency values.
Aggregating HTTP and Voice results is not yet supported.
Individual test results
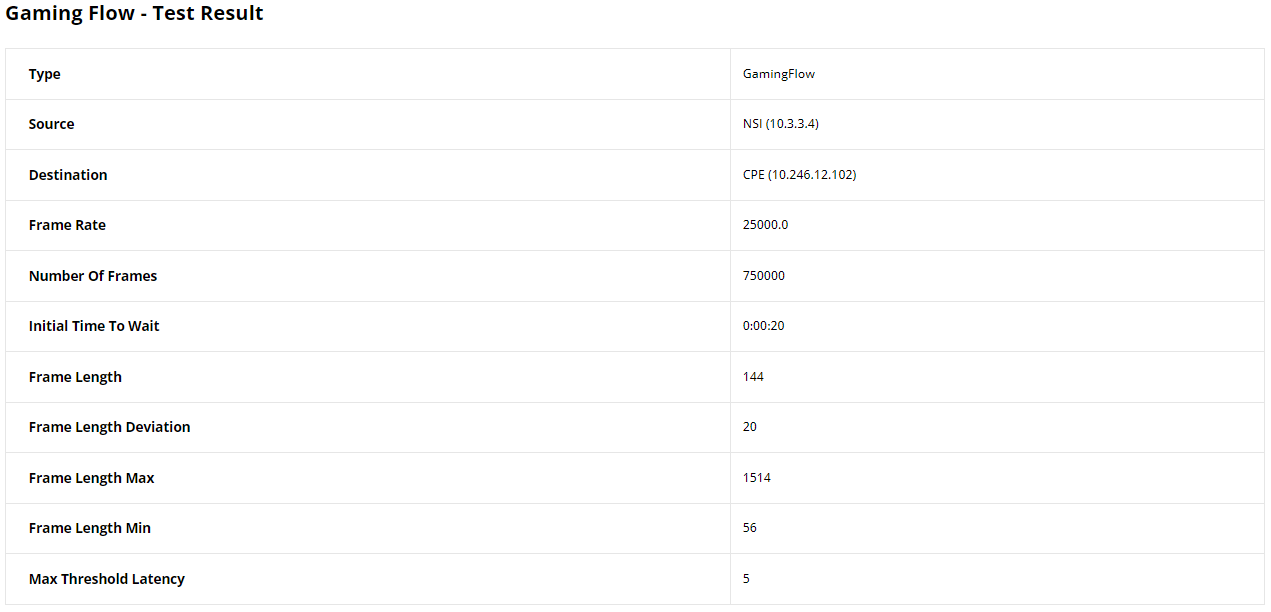
For every flow section, we provide first a table displaying the configuration of the UDP flow, including source and destination details, frame rate or bitrate, etc, depending on the flow type. This information serves as a reminder of the configuration to better understand the flow’s behavior during the test. For example, a Gaming flow configuration table is as follows:
Note
In flow individual results where the test status is marked as FAIL, this indicates that the flow results have not met certain Quality of Service (QoS) benchmarks. These benchmarks encompass a range of criteria, including minimum, maximum, and average latency, loss thresholds, average (MOS) for voice flows, etc. The failure cause(s) will be stated then under the test status of a flow.
The remaining individual test results per flow type contain the following:
UDP Frame Blasting Test Results
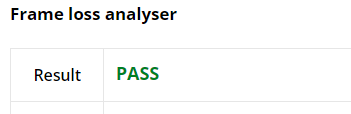
This section provides result statistics for the UDP traffic analysis. The Frame loss analyser highlights some result statistics concerning transmission and reception. First, we have the test status which is PASS in this case.
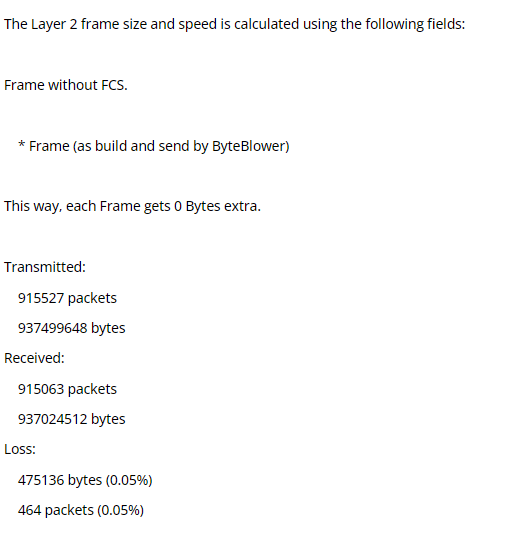
Next, you will find some important statistics: The number of packets/bytes transmitted and received, and any packets/bytes losses incurred. These results are pivotal for diagnosing issues related to packet delivery and network congestion.
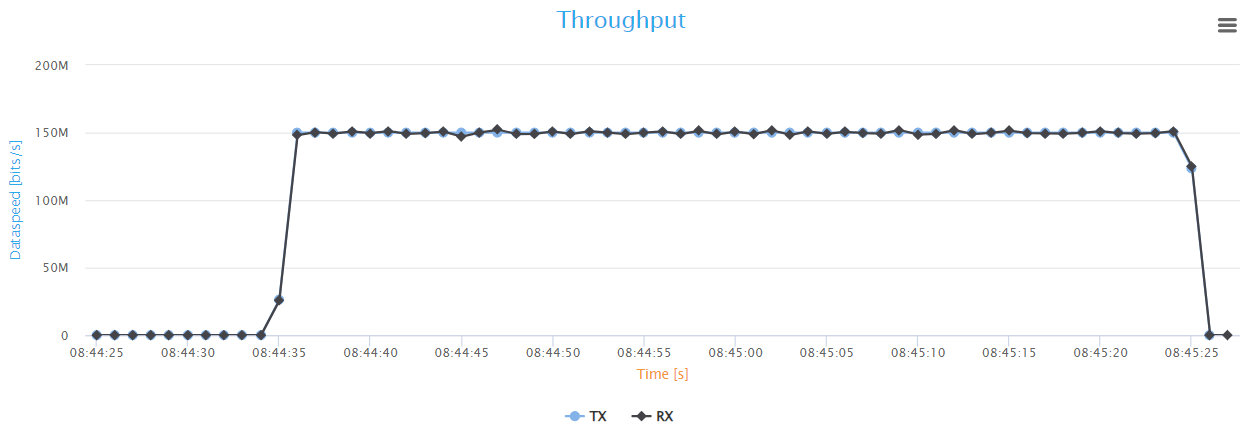
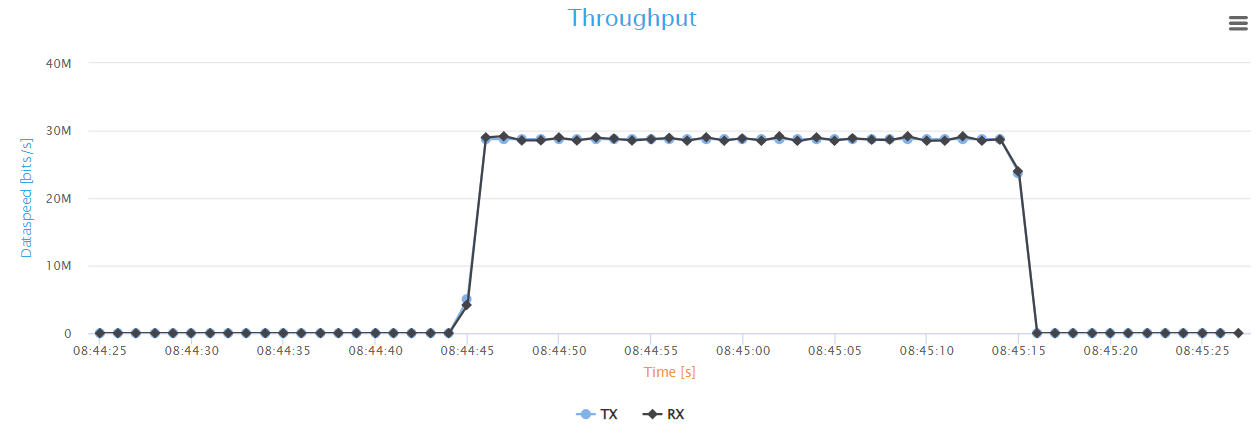
Finally, the report features a graph that illustrates the variation over time of the Tx/Rx throughput.
Note
When latency analysis is enabled, the Frame Latency CDF and Loss Analyser reports also other critical latency statistics including minimum, maximum, average, average latency jitter (variation in time delay between packets), etc. These results are pivotal for diagnosing issues related to packet timing and network congestion.
Gaming Flow
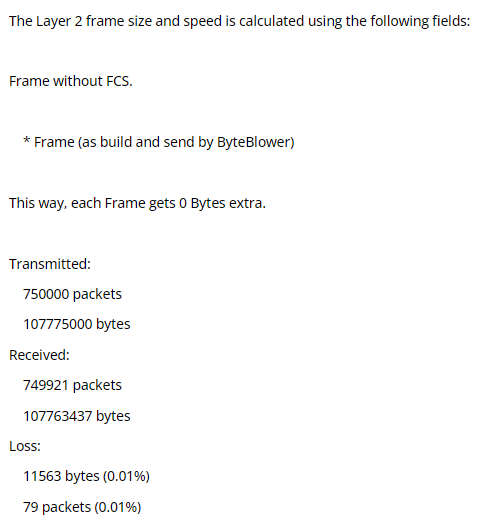
The gaming flow can use the same analysers as the UDP. In this instance, the Frame loss analyser is used, and highlights some transmission and reception statistics. The test status is indicated as PASS in this scenario.
Again, you will find then several statistics like: The number of packets/bytes transmitted and received, and any packets/bytes losses incurred.
Finally, the report presents the variation over time Tx/Rx throughput graph.
Note
Latency analysis also can be enabled for this flow
Voice Flow
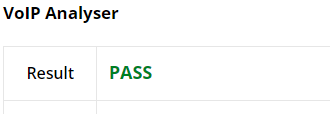
This section provides result statistics for the VoIP traffic analysis. the VoIP Analyser highlights many crucial result statistics to evaluate the voice traffic quality. First, we have the test status (PASS in this case).
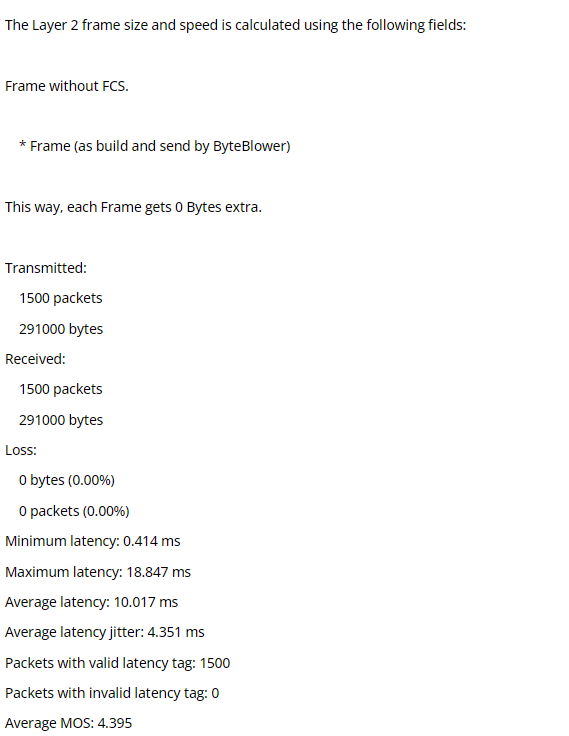
Next, you will find some important statistics, such as: The number of packets and bytes transmitted and received, packets/bytes loss, minimum, maximum, average latency, average Mean Opinion Score MOS (indicates the voice quality), etc.
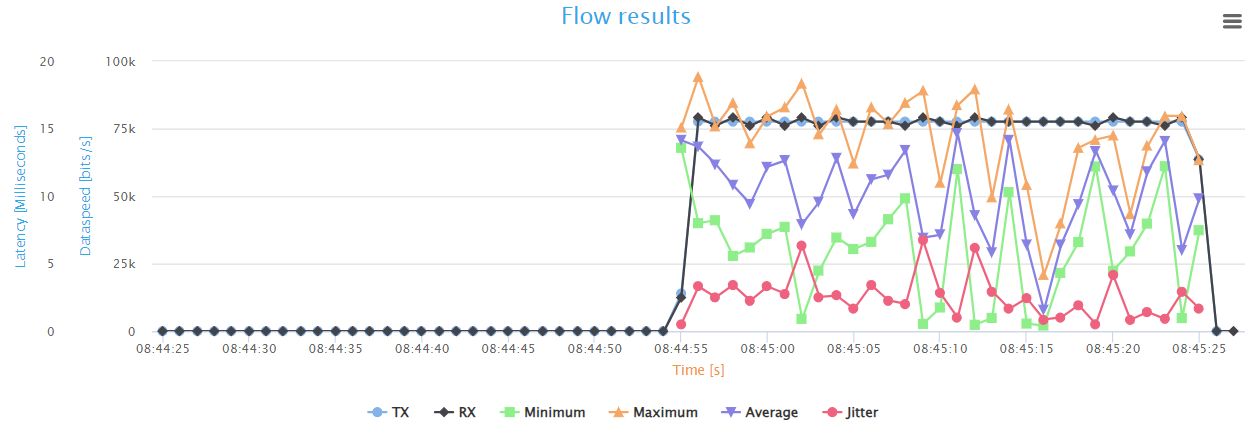
Finally, the report features a graph that illustrates the variation over time of the Tx/Rx throughput, latency statistics, and average Jitter.
Basic HTTP Test Results
The last part of this report illustrates Basic HTTP flow results. Currently, we do not provide post-processing of HTTP test results. That’s why it is shown No analysis performed in the report.
The HTTP analyser provides a comprehensive statistics graph that summarizes key performance metrics such as throughput, goodput, retransmissions, and round-trip time, providing insight into the network’s efficiency and stability in handling web traffic. The goodput shows the actual application-level throughput, retransmissions point to loss or errors, while round-trip time indicates the network’s latency.
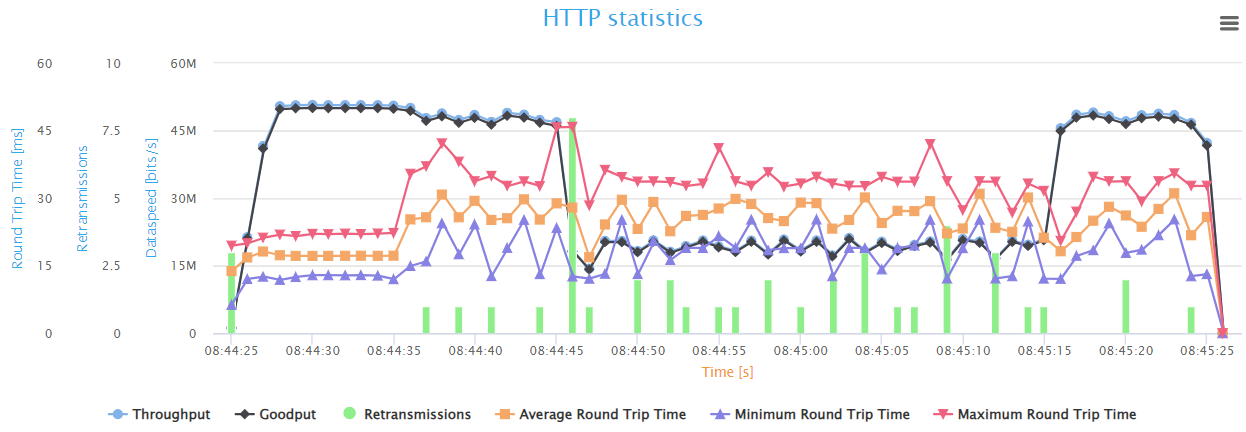
The graph presents a snapshot of the HTTP flow behavior during the test. Initially, the network shows optimal performance with the highest possible throughput and minimal latency, indicating a smooth flow of HTTP traffic. However, once the UDP background traffic begins after 10s, we can see that the throughput and goodput have decreased slightly (around 4%), with an increase in Round-Trip Time (RTT) measurements and retransmission count, which indicates higher latencies and loss ot packets.
when the other background flows start, we notice a tremendous drop in throughput/goodput (around 60%), mostly due the Gaming flow (Voice flow has a very low speed). Additionally, these speeds fluctuate up and down during this phase. indicating unstable behavior of the HTTP flow, and the network is struggling to handle the extra data properly. Also, the latency measurements are consistently high, and more retransmissions are occurring meaning even more loss of traffic.
Once the Gaming traffic stops, we notice that the HTTP flow experience less retransmissions, and have higher speeds, while latency measurements are still high due to the remaining high-speed UDP flow.
This period of congestion demonstrates the susceptibility of standard HTTP traffic to high loads on the network, which gives valuable insights to help in tuning the system to maintain high service levels during peak times.