Example: Low Latency - L4S
Test Scenario Definition
This test scenario is designed to closely mimic real-world network conditions by evaluating the impact of diverse background traffic flows on the performance and reliability of an HTTP flow. This approach aims to provide insights into the network’s capability to sustain high-quality service for critical web traffic in the presence of competing data flows. Such conditions are representative of complex enterprise networks or service provider environments, where a multitude of applications and services concurrently demand network resources.
To this end, we use and examine the behavior of two distinct HTTP traffic flows under same load conditions:
Basic HTTP Flow: This traffic flow emulates standard web activity, providing a baseline for network performance under typical conditions.
L4S HTTP Flow: Running independently after the Basic HTTP flow. This flow tests a more sophisticated traffic handling method that aims to maintain low latency and loss even in congested environments.
The configuration for this scenario includes a selection of background traffic types, each having particular patterns and may influence differently the overall network behavior:
Basic UDP Flow: Represents high-volume background traffic, typical of streaming, broadcasting, or bulk data transfers, etc.
Gaming Flow: Simulates the dynamic and interactive traffic generated by basic online gaming applications.
Voice Flow: Simulates VoIP services.
The runtime order of all flows involved in this scenario is as depicted below:
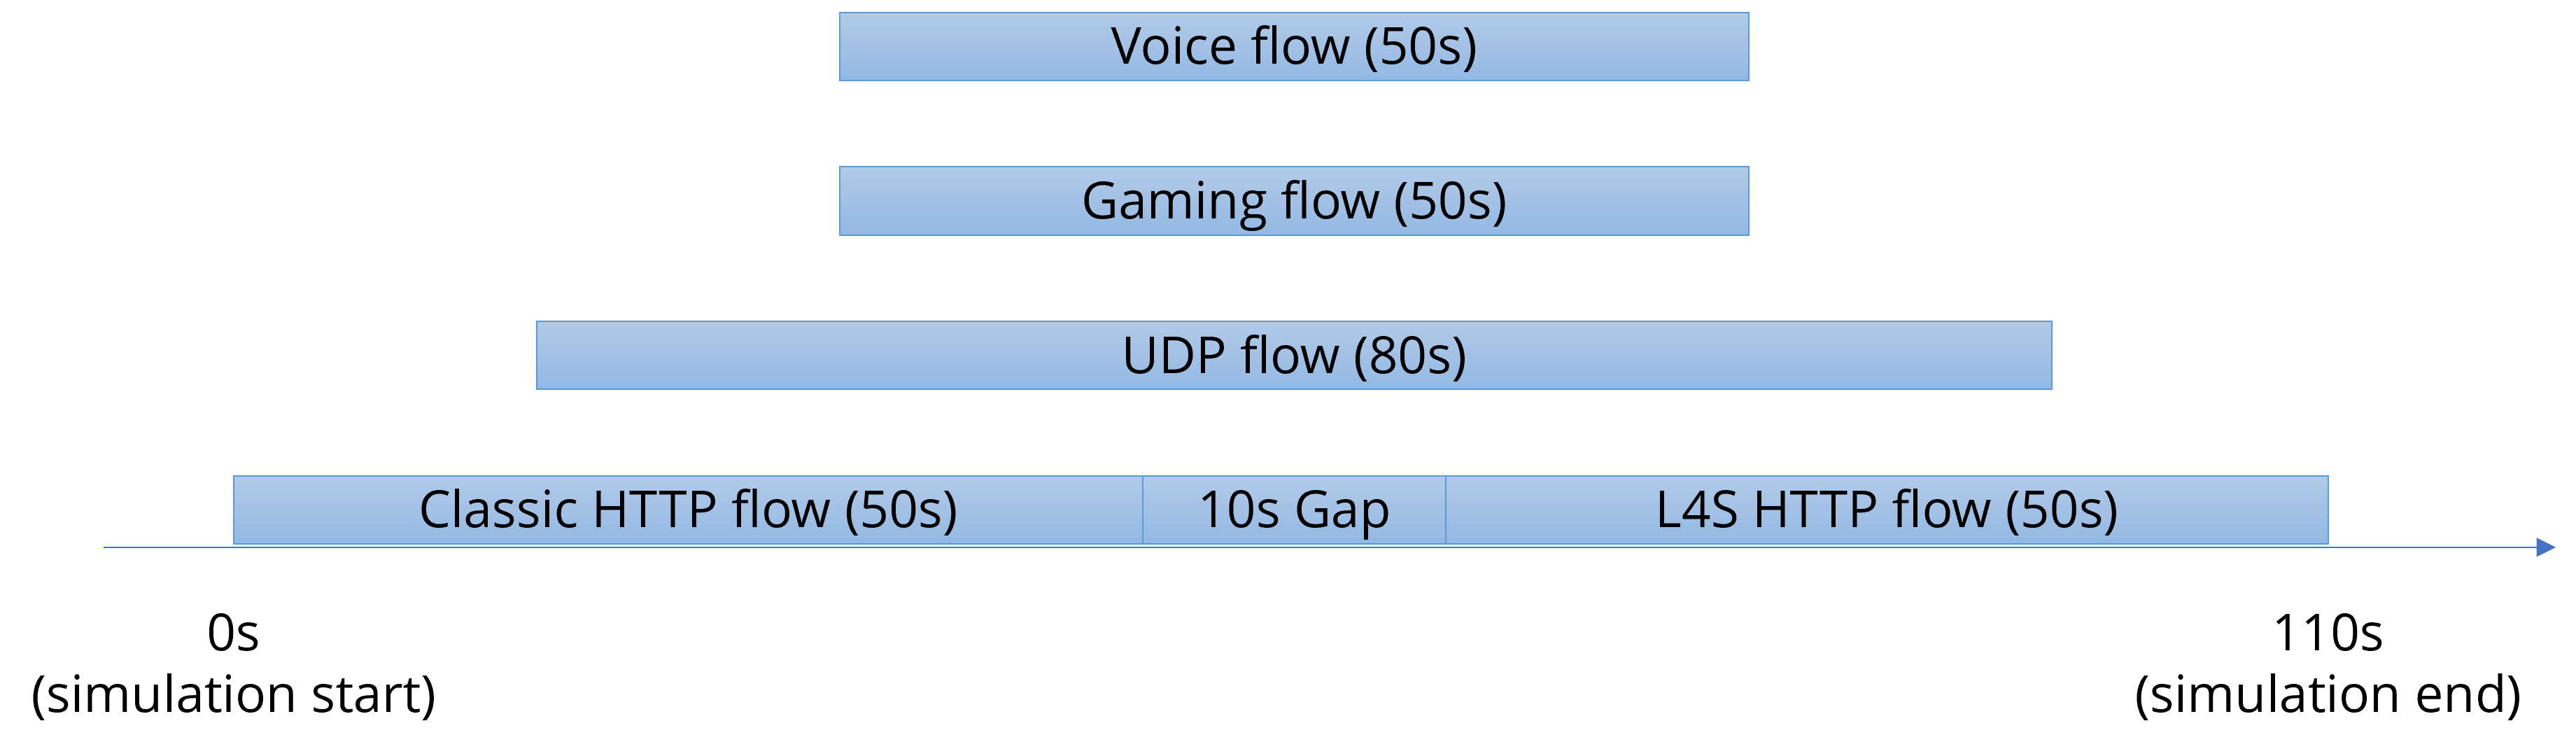
The resulting data will demonstrate the differential behaviors between Basic and L4S traffic, particularly how L4S technology enhances throughput, reduces latency, and improves the overall reliability of the flows. The results will also guide network optimization efforts, aiming to enhance the balance between traffic handling efficiency and service quality.
Run a test
The traffic test scenario can be run via command-line interface. You can use the following steps:
Create a working directory and (preferably) a Python virtual environment within.
Activate the virtual environment and install the ByteBlower Test Case.
Copy one of these example files into your working directory (based on what you want to test):
Update the example file to your own test setup (ByteBlower server, port/endpoint configuration, etc.)
Run the test from your working directory using the command line interface:
byteblower-test-cases-low-latency
python -m byteblower.test_cases.low_latency
More details regarding these steps are given in Installation & Quick start.
Result Highlights
In this section, we explain the structure of the HTML report, and how to interpret the findings.
Test status & environment
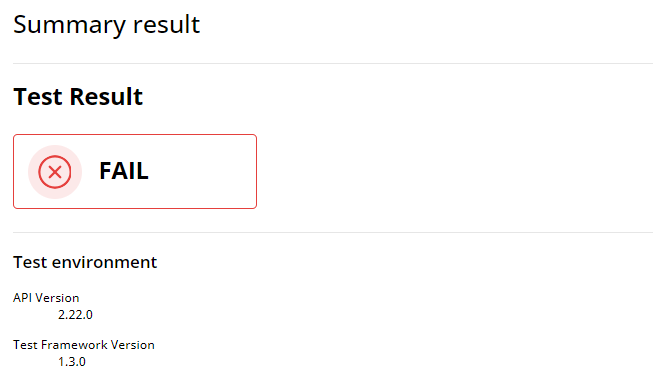
The first part of the report contains the overall test status, which indicates whether the network performance met or failed the predefined requirements. These requirements typically include maximum tolerated packet loss and latency thresholds, among others. A test is considered as failed if at least one flow status is FAIL (the actual failure cause(s) are indicated in the individual flow results).
The test environment section provides essential details on the API and the ByteBlower Test Framework versions used for the test. In this instance, API version 2.22.0 and ByteBlower Test Framework version 1.3.0 were used.
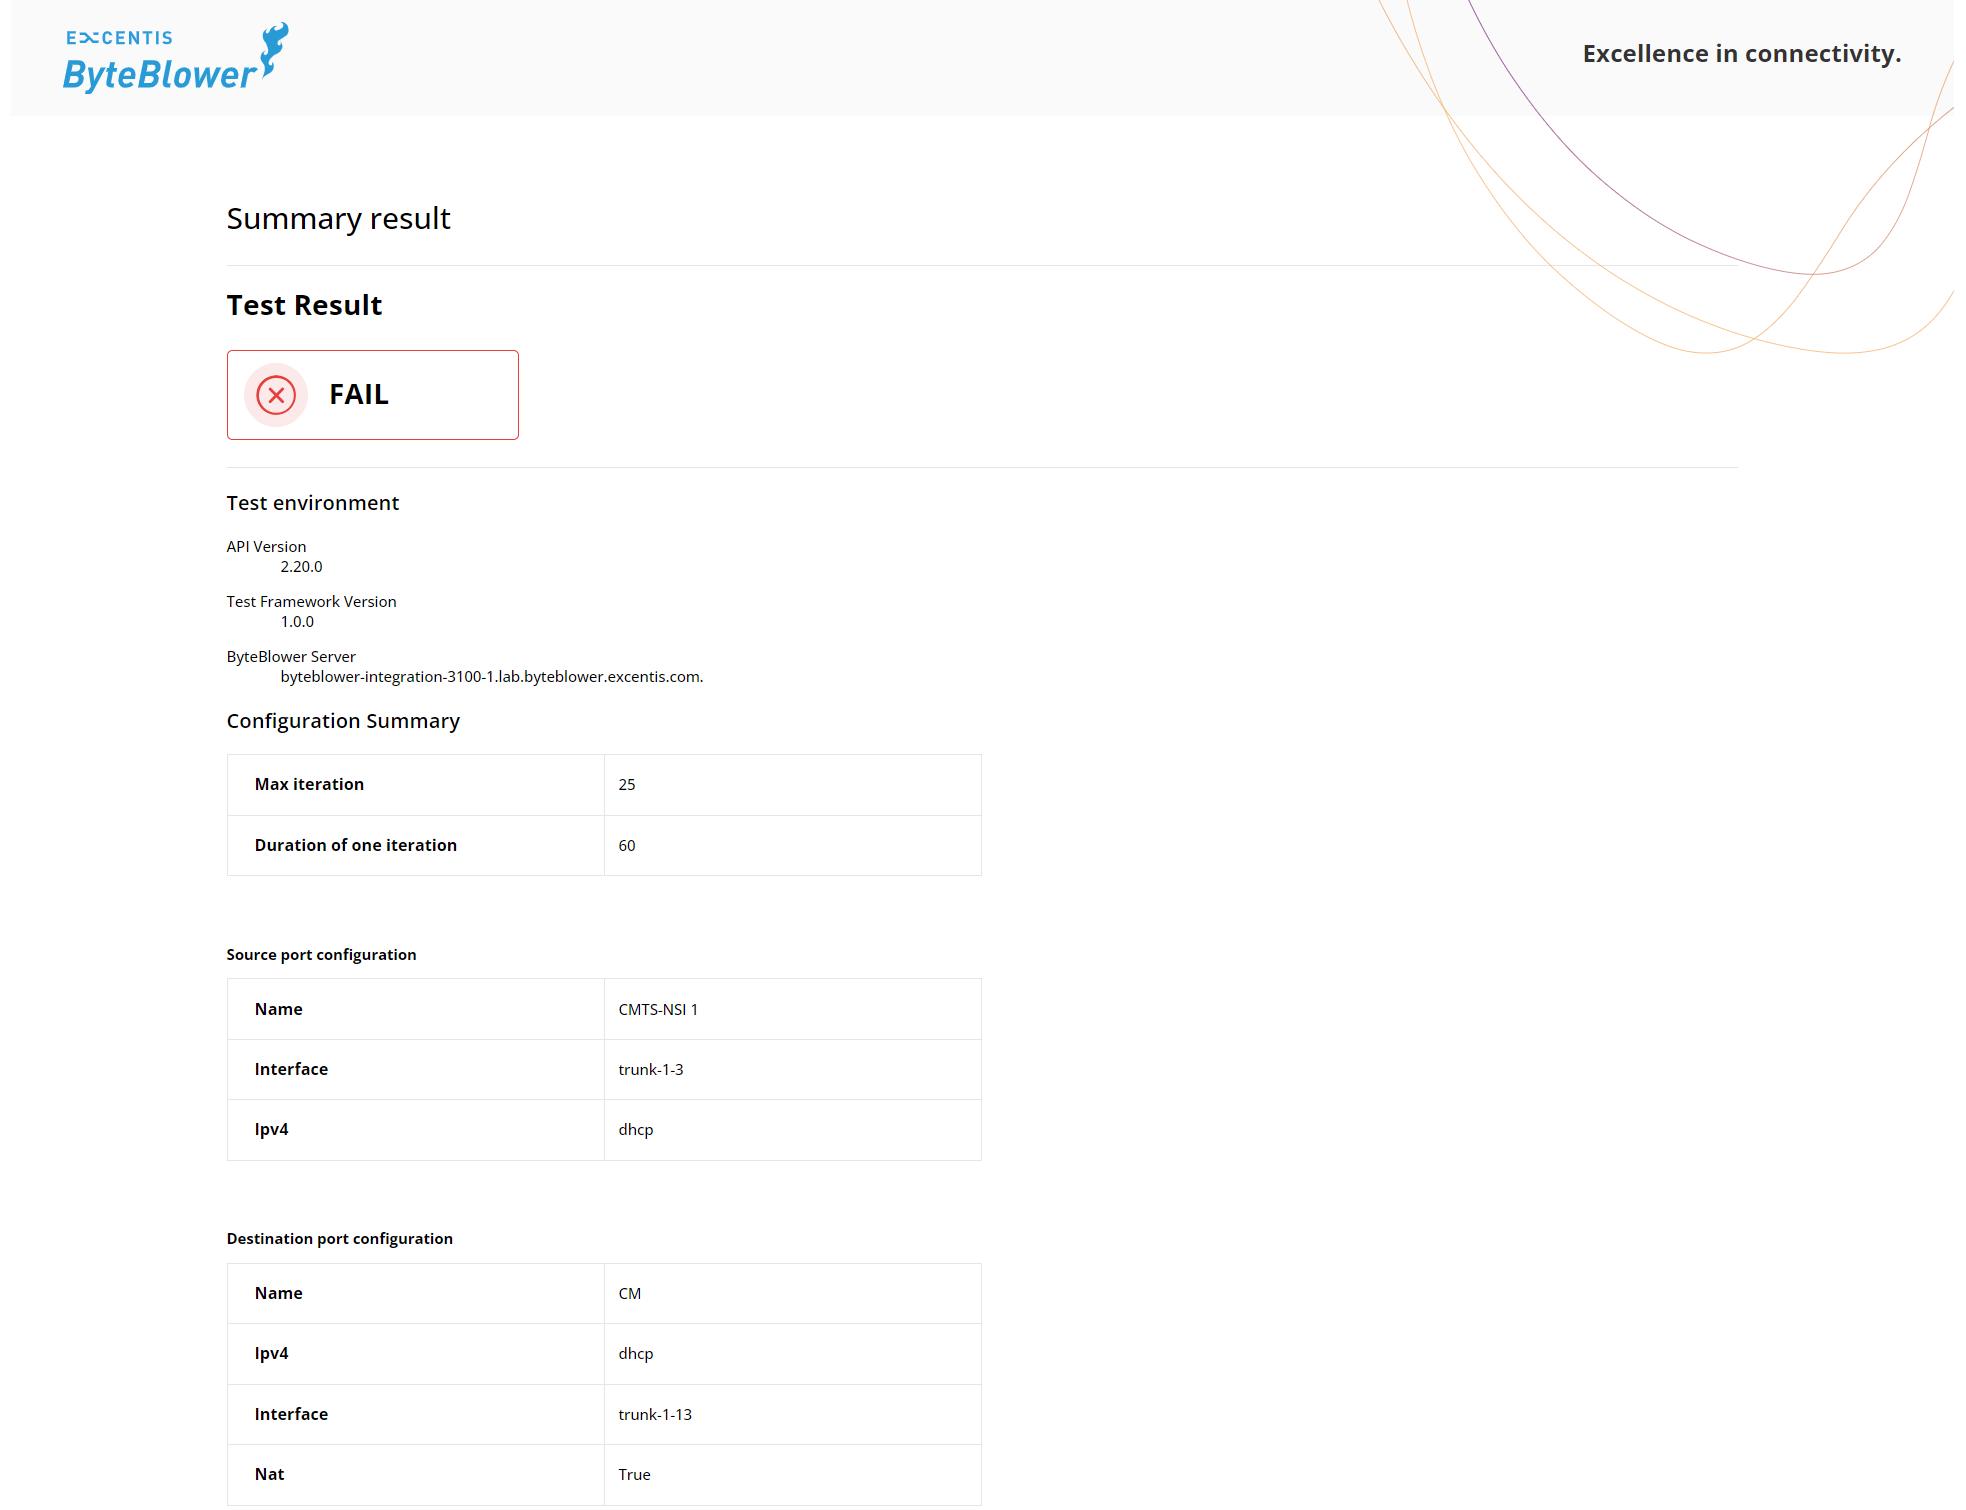
Ports and config
Next, you will find the port configuration table that outlines the setup of the network ports involved in the test, including IP addresses, network masks, gateways, etc.
Correlated test results
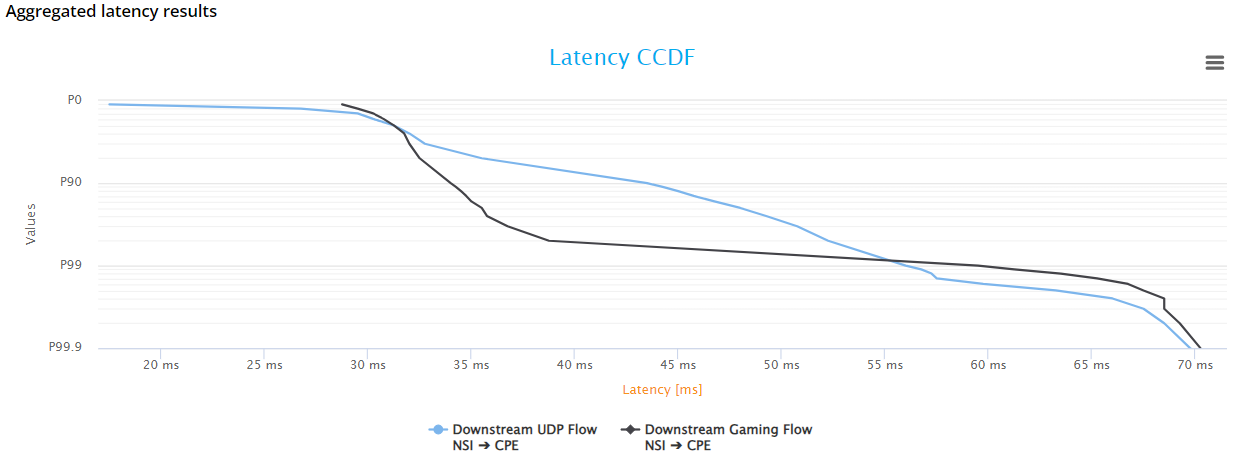
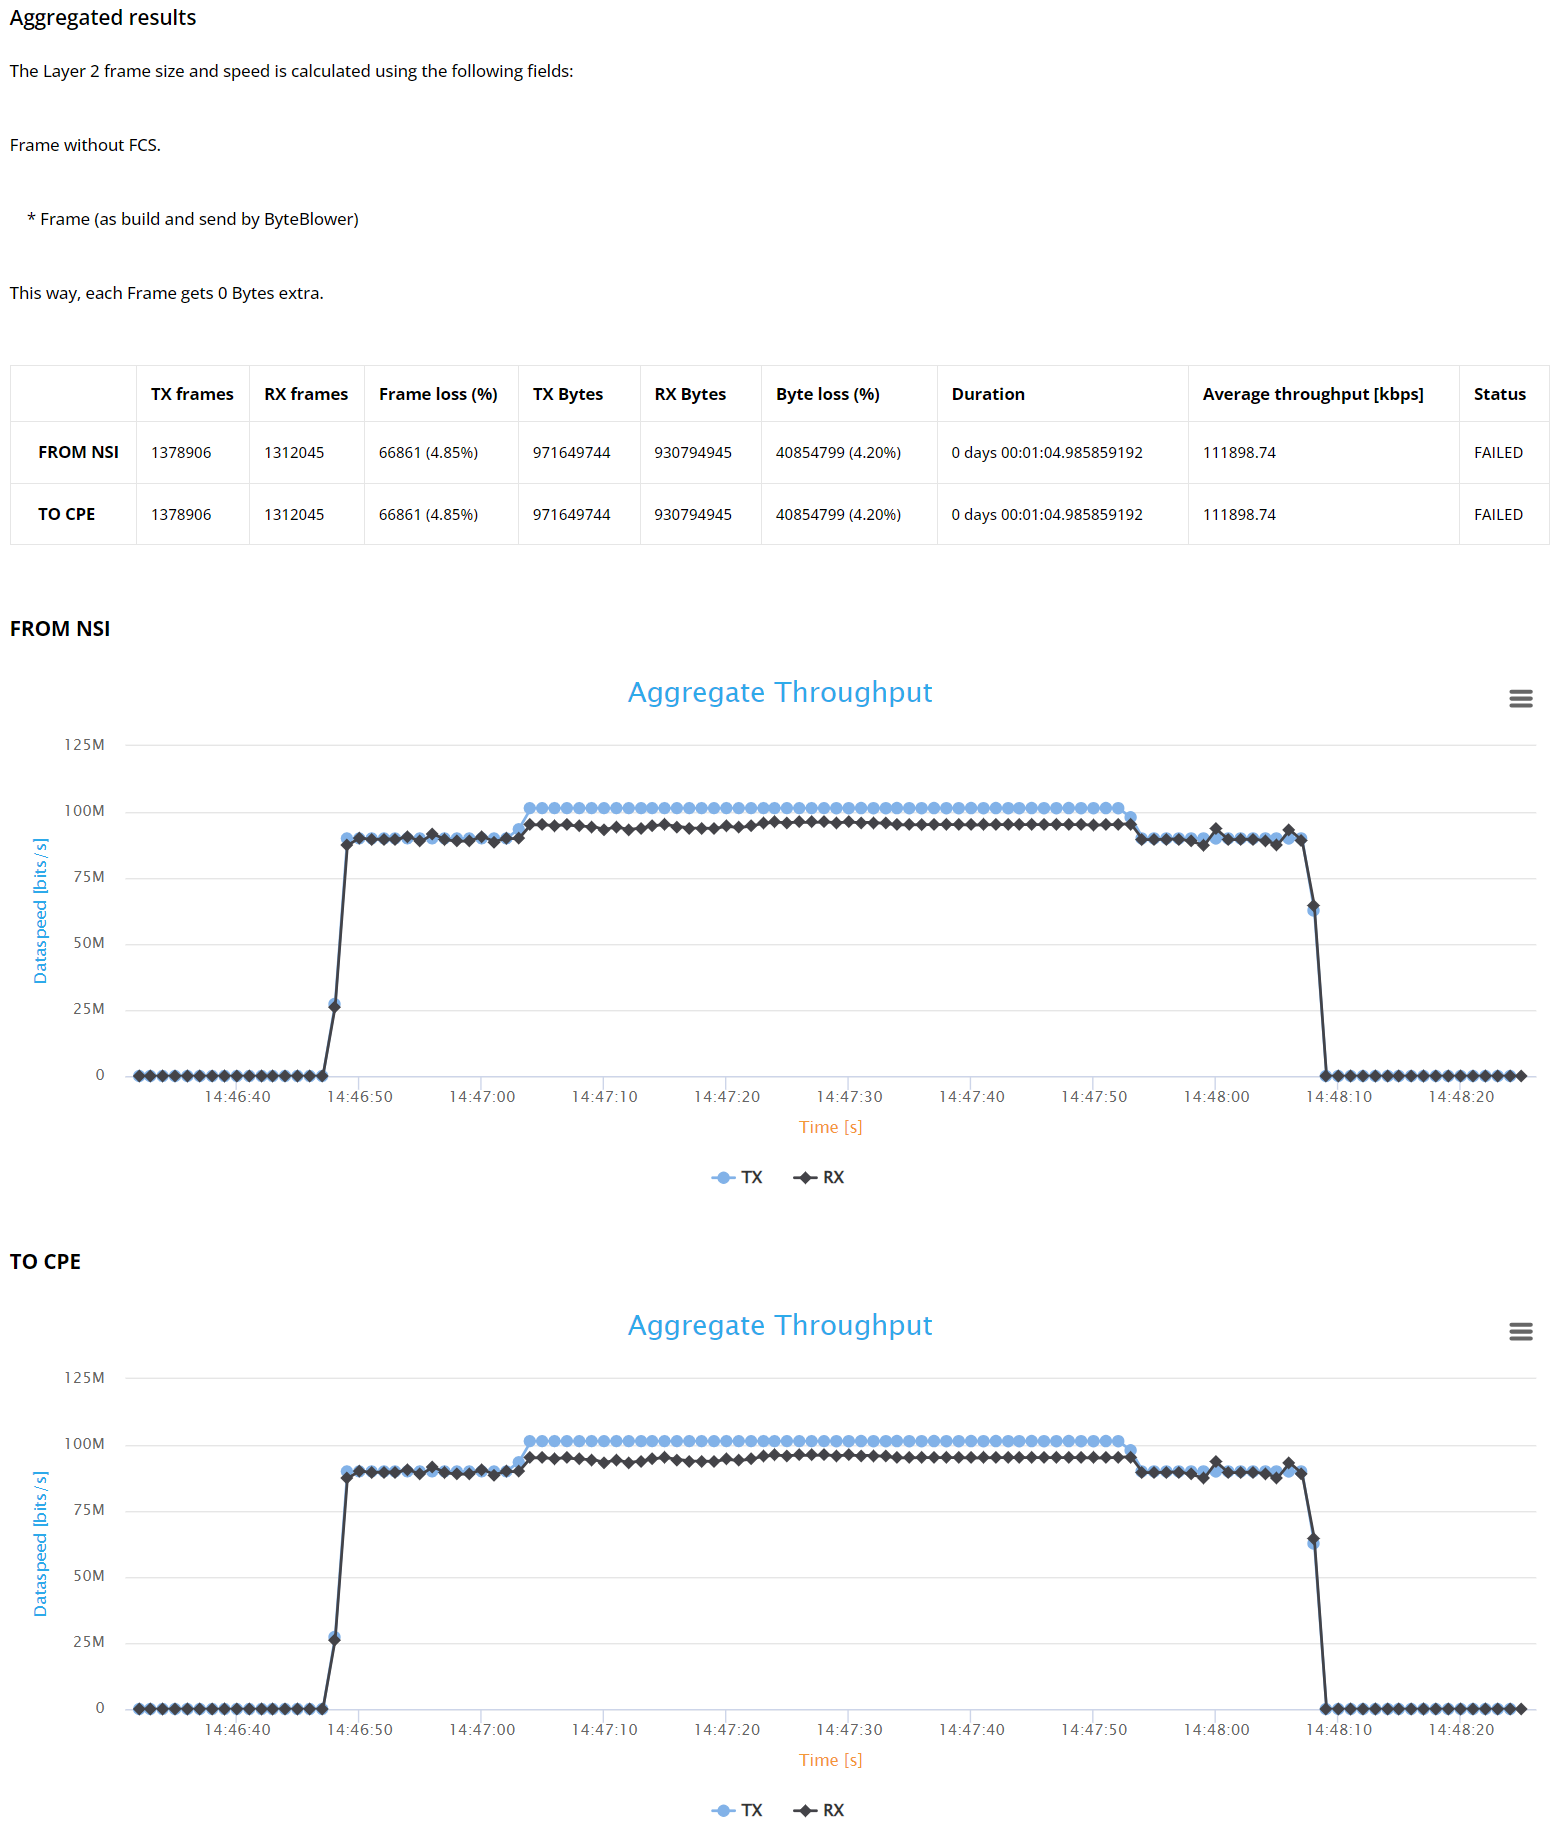
The report then presents the correlated test results, which aggregate the throughput measurements for UDP flows. When latency analysis is enabled, this section starts with the aggregated latency CCDF results. The CCDF graph indicates the percentage of packets with latencies below or above specific latency values.
Next, when multiple UDP-based flows are used, you’ll find a table summarizing transmission (Tx) and reception (Rx) statistics per transmitting/receiving port, including: Tx/Rx frames and Bytes, duration, average throughput, etc. Then, it presents aggregated throughput graphs for each port involved in transmission and reception.
Note
Aggregating HTTP and Voice results is not yet supported.
Individual test results
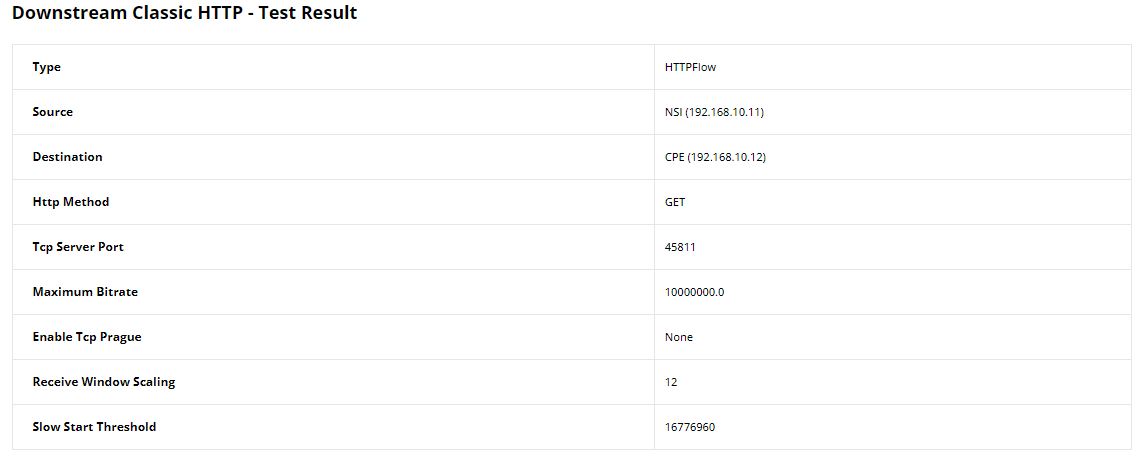
For every flow section, we provide first a table displaying the configuration of the UDP flow, including source and destination details, frame rate or bitrate, etc, depending on the flow type. This information serves as a reminder of the configuration to better understand the flow’s behavior during the test. For example, a Downstream Classic HTTP configuration table is as follows:
Note
In flow individual results where the test status is marked as FAIL, this indicates that the flow results have not met certain Quality of Service (QoS) benchmarks. These benchmarks encompass a range of criteria, including minimum, maximum, and average latency, loss thresholds, average (MOS) for voice flows, etc. The failure cause(s) will be stated then under the test status of a flow.
The remaining individual test results per flow type are as follows. In this example, latency analysis is enabled for all UDP-based flows.
UDP Frame Blasting Test Results
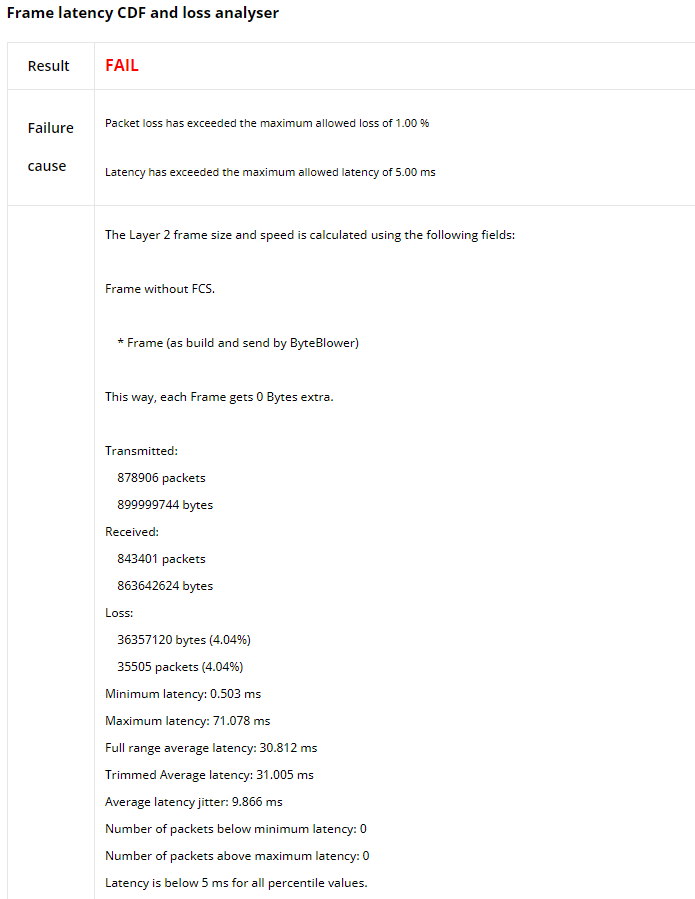
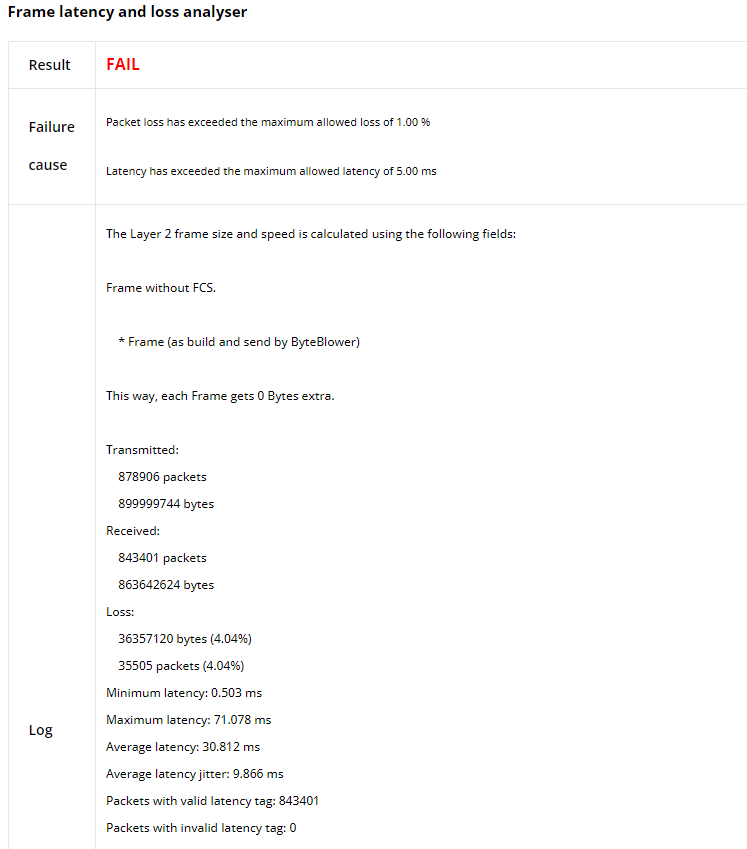
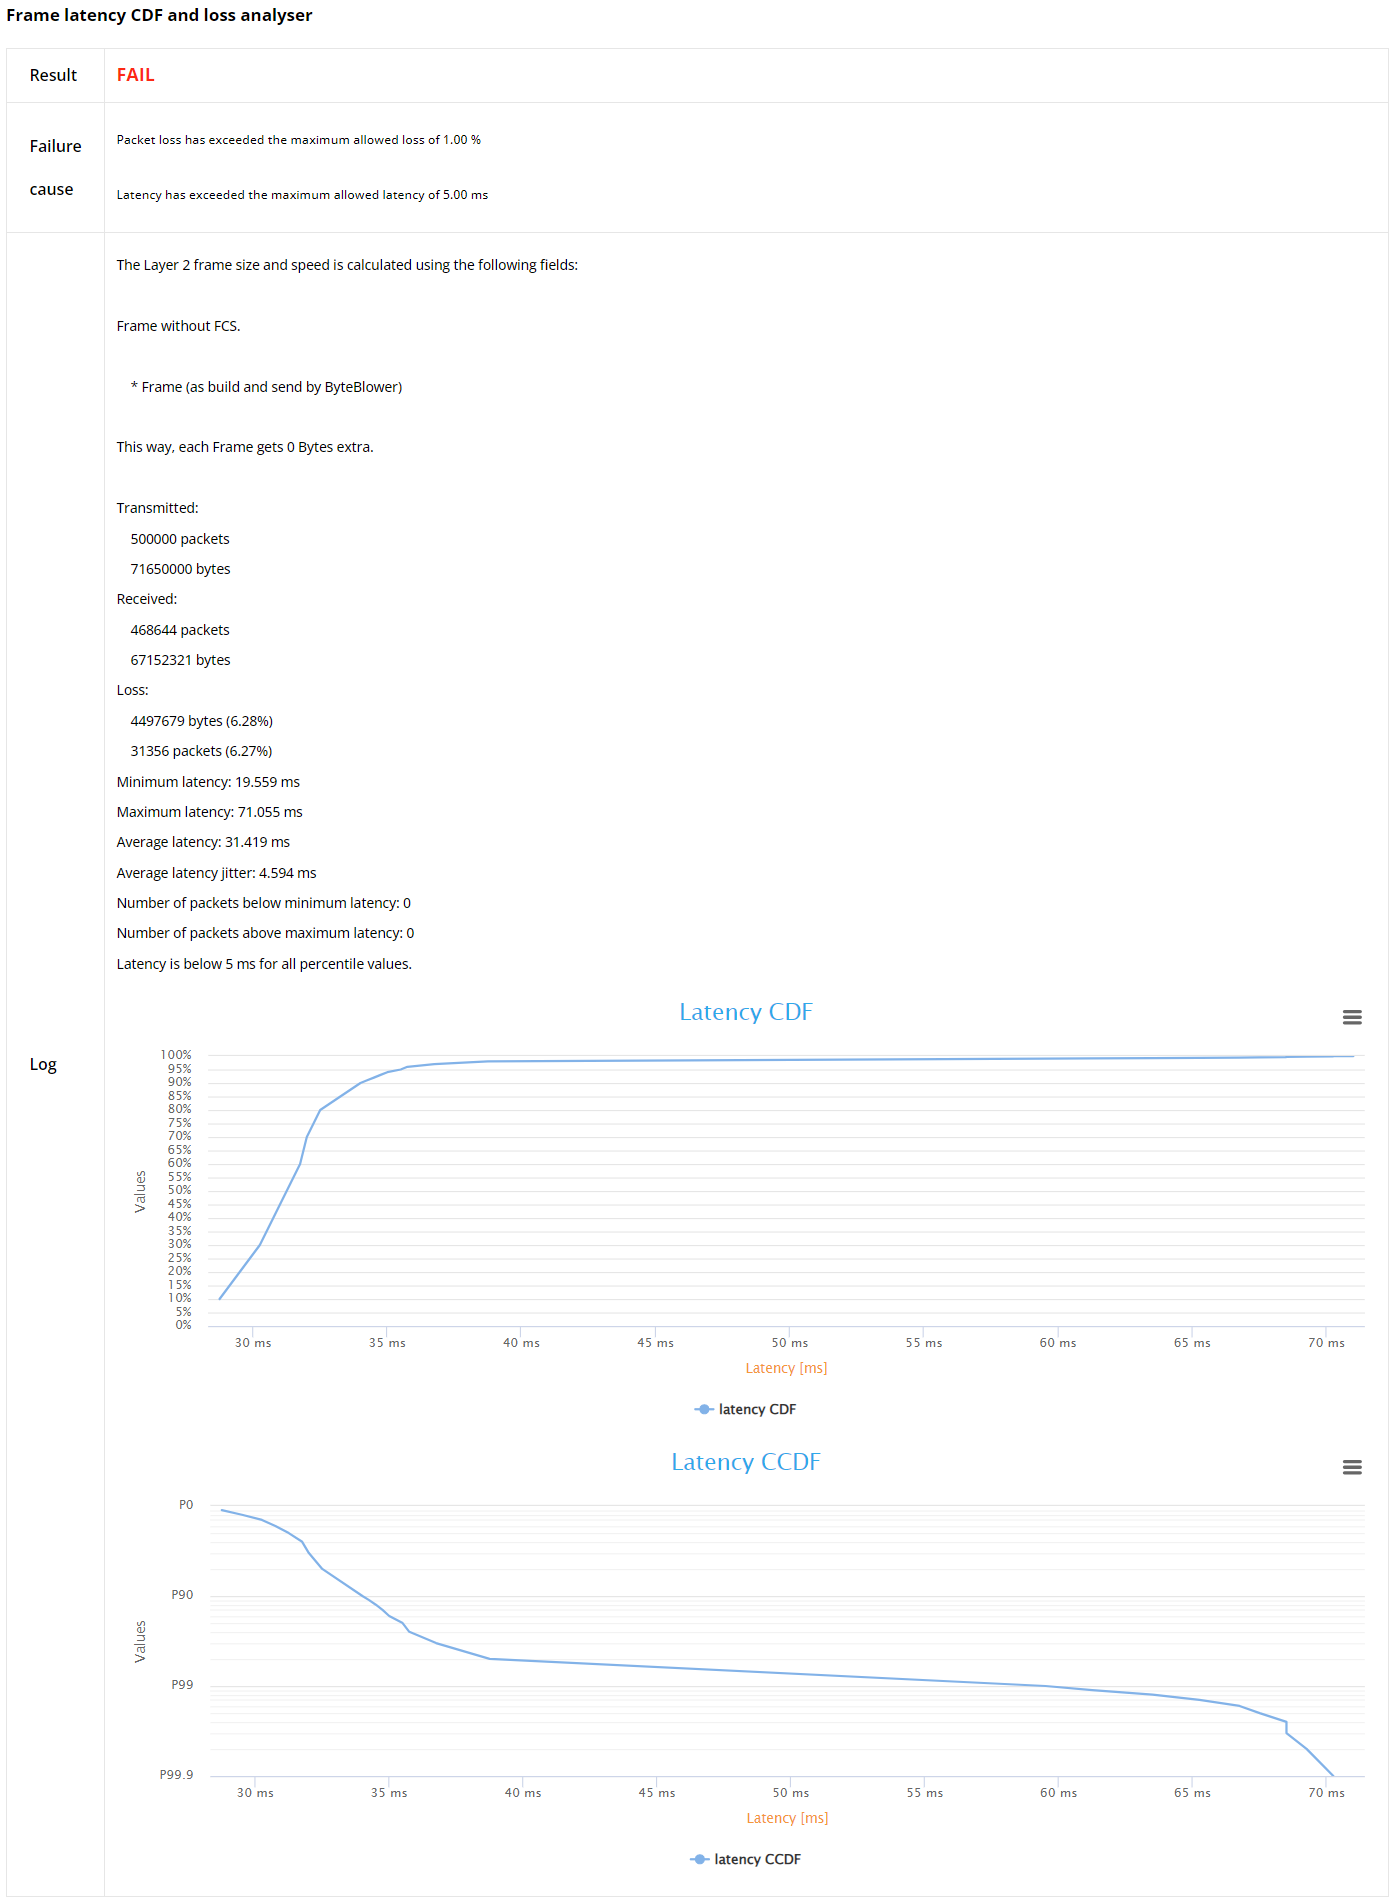
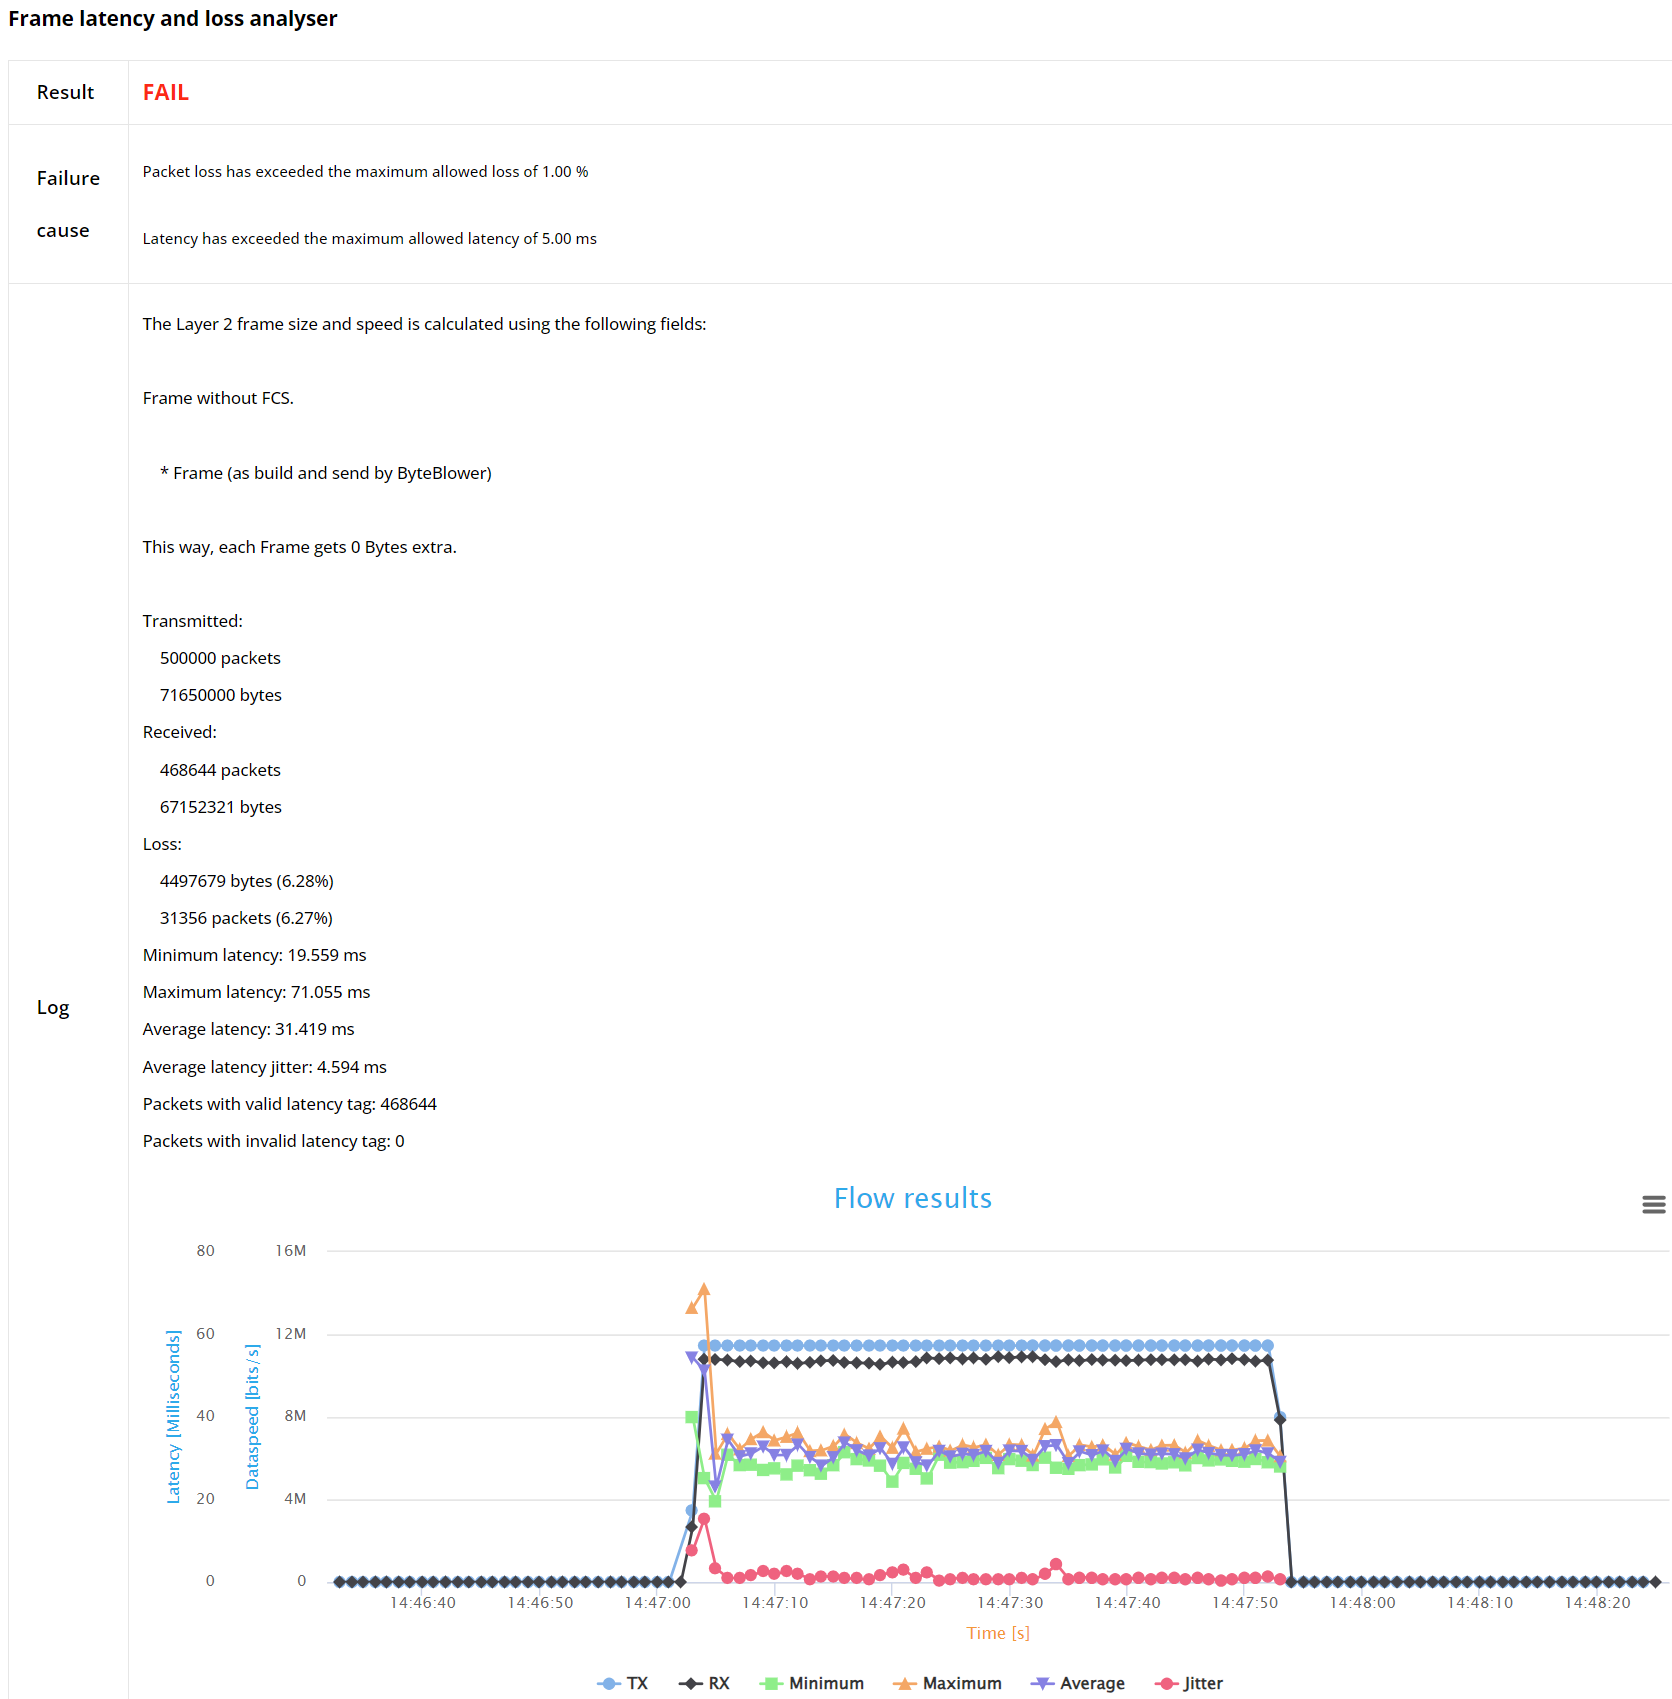
Since latency analysis is enabled, this section starts with the Frame Latency CDF and Loss Analyser. First, which details the performance of the UDP traffic. We first have the test status (which is FAIL in this case) in addition to failure cause(s).
Then, it reports critical statistics such as the number of packets/bytes transmitted and received, any losses incurred, latency figures including minimum, maximum, average, average latency jitter (variation in time delay between packets), and the number of packets below/above latency histogram thresholds. These results are pivotal for diagnosing issues related to packet timing and network congestion.
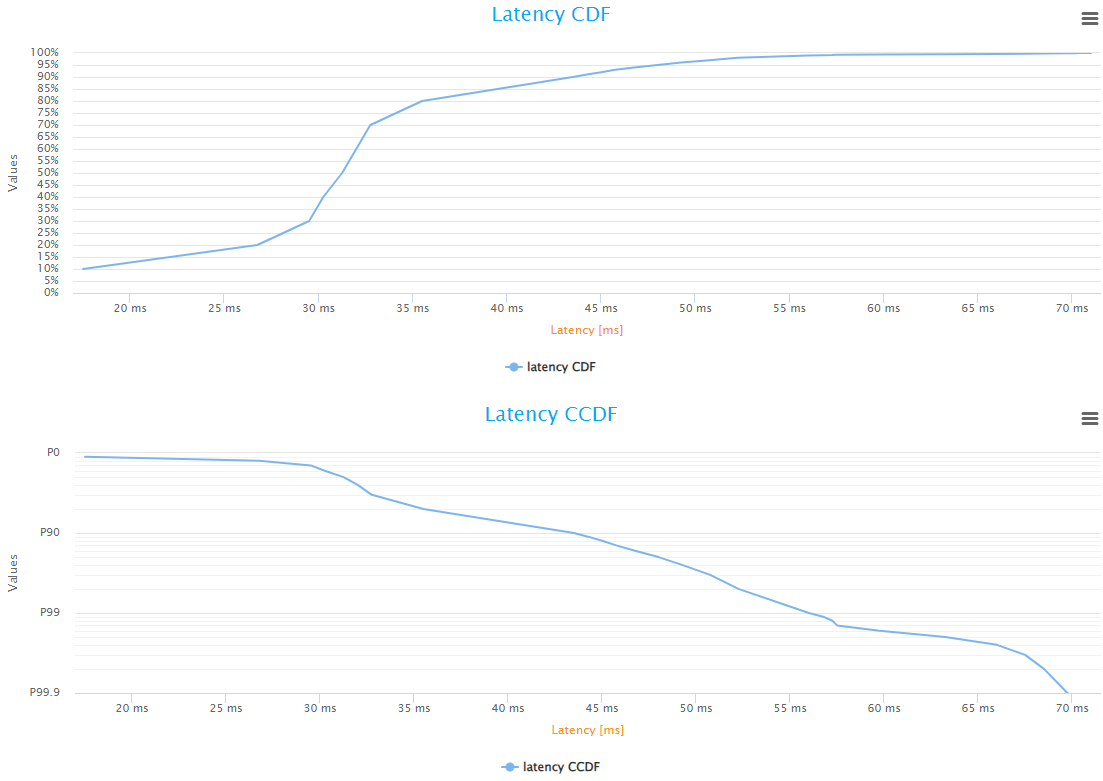
Accompanying the previous data are the Latency CDF/CCDF graphs. The Latency CDF graph plots present the percentage of latency falling below a given threshold, offering a perspective on the overall latency distribution. Meanwhile, the Latency CCDF graph complements this by illustrating the latency distribution, to identify the proportion of packets experiencing latencies that are lower/higher than certain latency values for understanding the quality of service for time-sensitive applications.
Next, the results from the Frame Latency and Loss Analyser are presented. This section offers a summary of key performance statistics similar to the previous one, with a small difference. It provides the number of packets with (in)valid latency tags instead of the number of packets below/above latency thresholds.
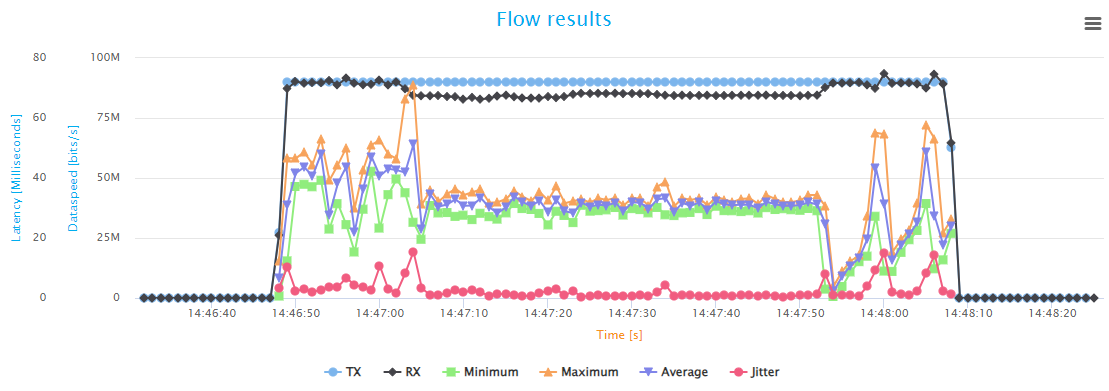
Finally, the report features a graph illustrating the variation over time of the Tx/Rx throughput, minimum/maximum/average latency, and jitter, providing a visual depiction of the network’s behavior during the test, and an indicator of network stability and performance.
Note
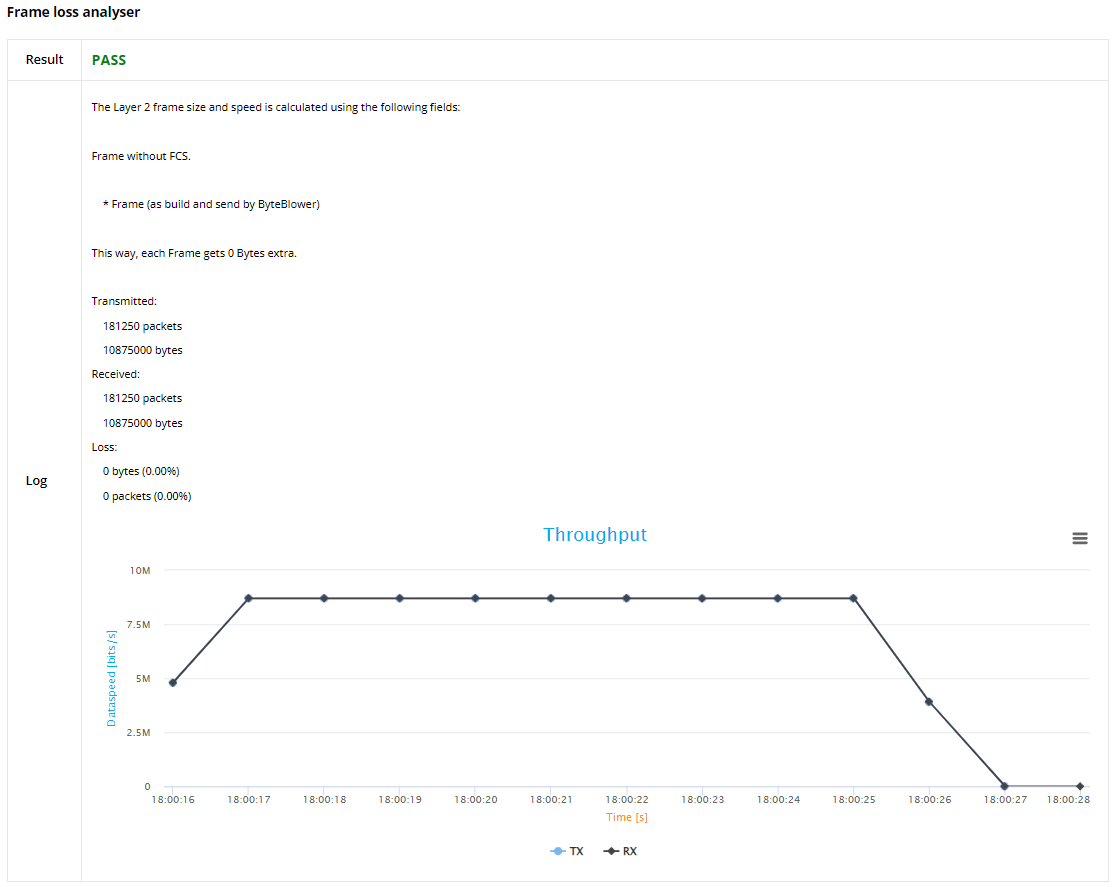
If latency analysis is not enabled, you will find the Frame loss analyser results that highlight transmission/reception and frame loss statistics, in addition to the throughput graph (in transmission and reception).
Gaming Flow
The gaming flow can use the same analysers as the UDP. In this instance, both the Frame Latency CDF and Loss Analyser and the Frame Latency and Loss Analyser are used, highlighting latency, and transmission and reception statistics.
The Frame Latency CDF and Loss Analyser starts with the test status of this scenario, which is indicated as FAIL, followed by the failure causes. Then, you will find the latency related statistics followed by the latency CDF and CCDF graphs like before.
Finally, this section ends with the Frame Latency and Loss Analyser.
Voice Flow
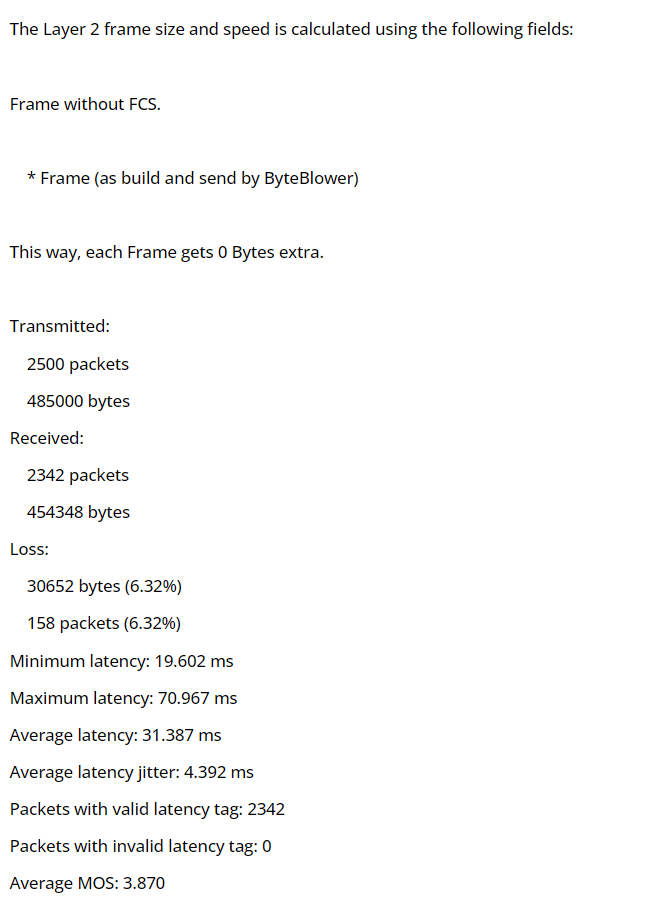
This section provides result statistics for the VoIP traffic analysis. the VoIP Analyser highlights many vital result statistics to evaluate the voice traffic quality. First, we have the test status (FAIL in this case, followed by the failure causes).
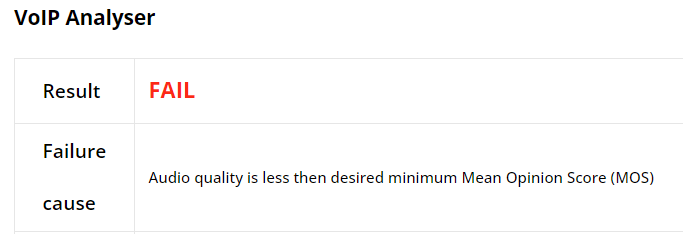
Next, you will find some statistics, such as: The number of packets and bytes transmitted and received, packets/bytes loss, minimum, maximum, average latency, average Mean Opinion Score MOS (indicates the voice quality), etc.
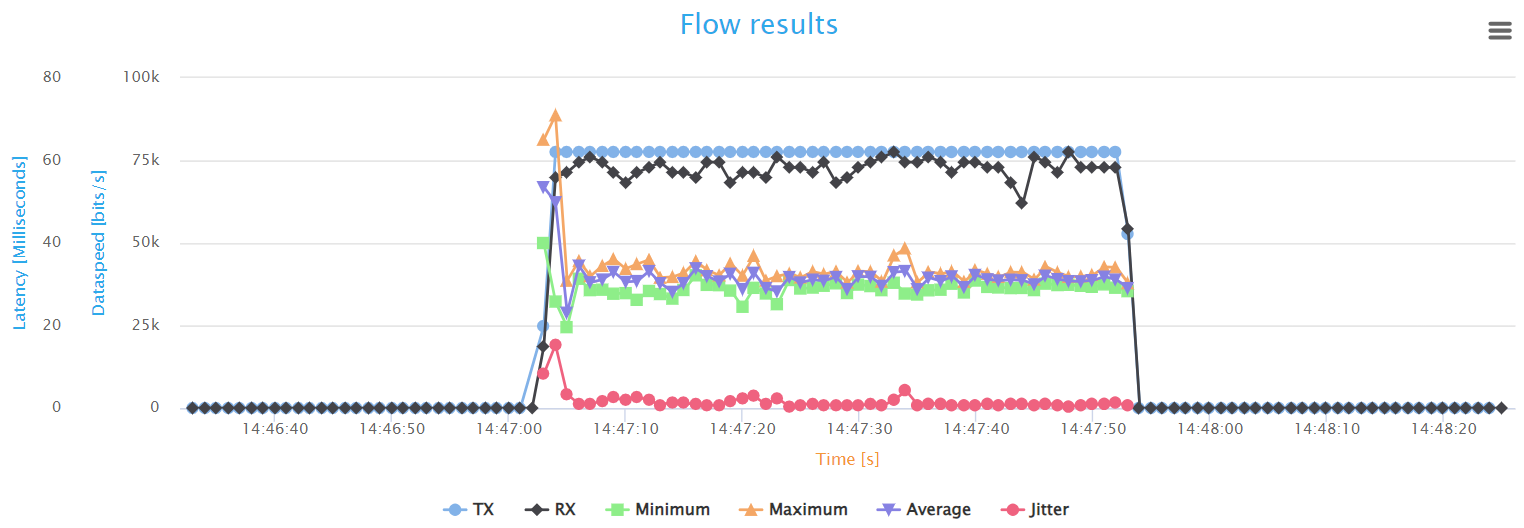
Finally, the report features a graph that illustrates the variation over time of the Tx/Rx throughput, latency statistics, and average Jitter.
Basic HTTP Test Results
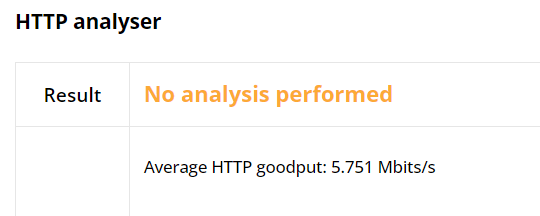
This section illustrates Basic HTTP flow results. Currently, we do not provide
key performance metrics (KPI) post-processing of HTTP test results. That’s
why No analysis performed is shown in the report. However, we do provide the
average HTTP goodput throughout the test as shown in the figure below:
The HTTP analyser provides a comprehensive statistics graph that summarizes key performance metrics such as throughput, goodput, retransmissions, and round-trip time, providing insight into the network’s efficiency and stability in handling web traffic. The goodput shows the actual application-level throughput, retransmissions point to loss or errors, while round-trip time indicates the network’s latency.
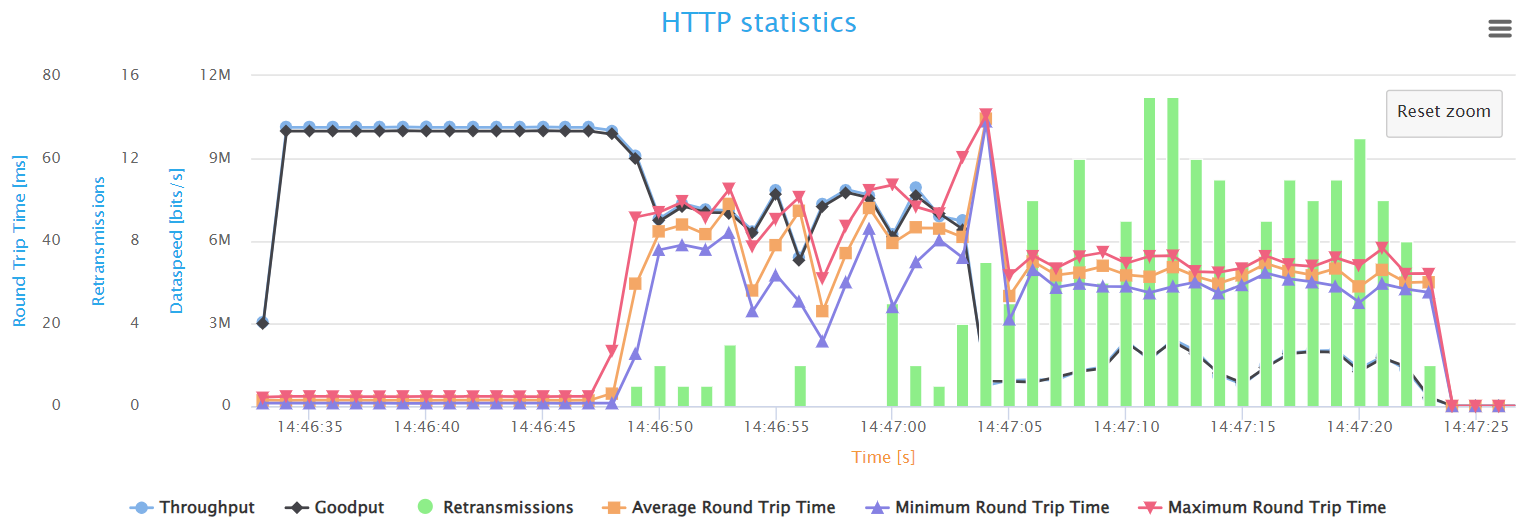
The graph shows the performance of the HTTP traffic over time during the test.
At first, since the network is uncongested, we notice optimal performance
expressed in high speed and low latency measurements, meaning HTTP traffic
moves smoothly. After 10 seconds, when UDP traffic starts, the HTTP speeds
decrease drastically (by about 20 to 40%) and fluctuate up and down,
retransmissions start occurring, and the average Round-Trip Time (RTT)
jumped from 1.4ms to around 40ms. These findings indicate that the network
experiences lower and unstable performance, higher delays, packet loss, and
extra traffic because of the retransmissions, and is struggling to operate
properly under heavy loads.
When the other background flows start, we notice a tremendous drop in throughput/goodput (almost 85%), mostly due to the Gaming flow (Voice flow has a very low speed). Also, the latency measurements dropped slightly (to around 32ms) but still high. Finally, we notice many more retransmissions occurring in the network, meaning even more traffic loss and additional load on the network.
These findings demonstrate the susceptibility of standard HTTP traffic to high loads on the network, which gives valuable insights to help in tuning the system to maintain high service levels during peak times.
Downstream L4S HTTP Test Results
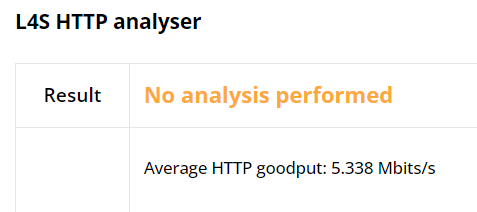
The last section of this report highlights the L4S HTTP flow test results.
Similar to the previous HTTP analyser, no KPI post-processing is
performed, only the average HTTP goodput throughout s calculated, as shown
in the figure below:
The L4S HTTP Statistics graph shows important performance measures similar to
those of classic HTTP, such as: Throughput, goodput, retransmissions, and
round-trip time (RTT). Additionally, it tracks the number of ECN
(Explicit Congestion Notification) markings per second, which indicate the
presence of network congestion through Congestion Experienced (CE) markings.
These CE markings alert the receiver that the sender should take early action
to prevent queue buildup and packet loss, thus maintaining low latency and
smooth throughput.
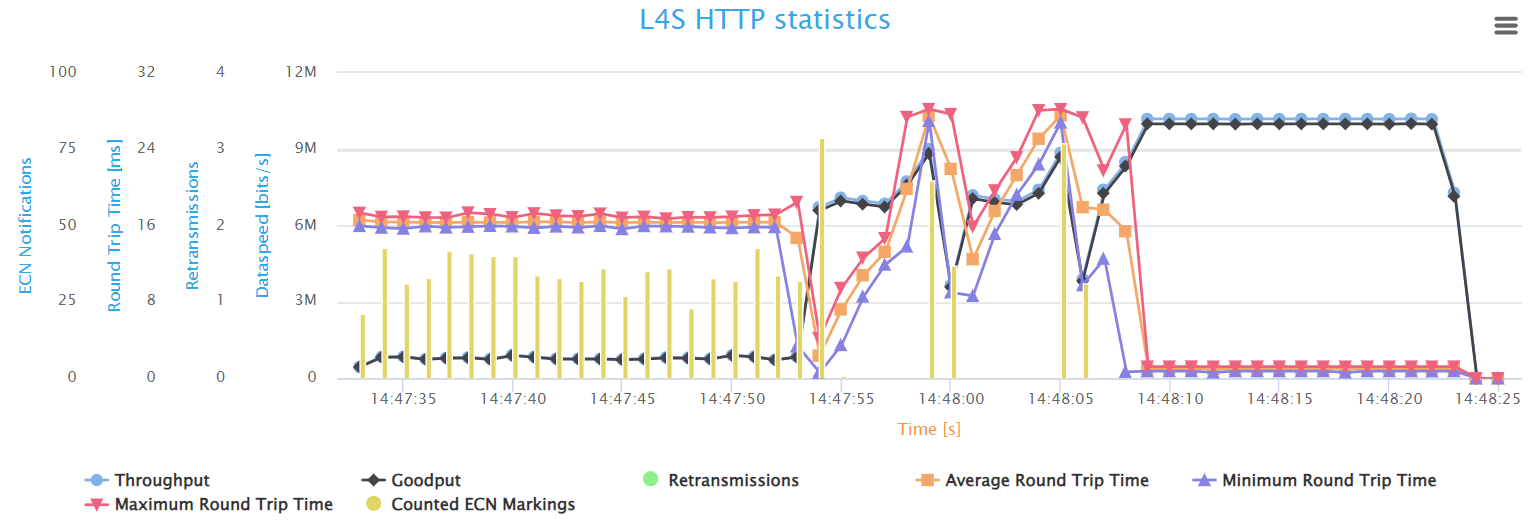
The L4S HTTP statistics graph demonstrates a more stable network performance
compared to the classic HTTP flow. In the first stage when all the background
flows are running, although the average throughput and goodput are very low at
around 0.73Mbit/s (90% drop), they are almost stable during this stage. Also
the RTT measurements are much lower than the Classic HTTP (average RTT
is around 16ms, which is 50% less). We notice also that the CE count is
consistently high due to the high congestion of the network.
The second stage starts when the Gaming and Voice flows stop (lowering the
load on the network). We can first notice the increase in throughput and
goodput speeds, and they are more stable compared to the Classic HTTP
counterparts. Also, we notice fewer CE markings over this stage, with very
few exceptions. As for RTT measurements, we notice some fluctuation, but
the values still are less than the Classic HTTP’s RTT (always under 30ms).
It’s worth noting that no retransmissions appeared during the previous two
stages no matter how congested the network was. this indicates that the
network has not experienced any packet loss
In the last stage, when all background traffic stops, The L4S HTTP flow reaches its optimal performance, with the highest speeds, lowest latency, and no packet loss.